
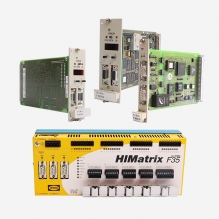
MP 3009X
Get A Quote
When I am on a plant floor trying to get a PLC cabinet back online, I do not care what a distributorŌĆÖs org chart looks like. I care about one thing: how fast the right part shows up at the dock, every time, without drama. That comes down to the strength of the distributorŌĆÖs network, not just the size of its catalog.
This article looks at Moore Automated and Grainger Industrial through that lens: as two distribution strategies competing to keep your automation running. Rather than speculate about proprietary details of their footprints, I will focus on how an automation engineer can analyze their distribution networks using principles drawn from supply chain and distribution network optimization research from Alpine Supply Chain Solutions, FlexHub, Sheer Logistics, Spendflo, ZINFI, Fortna, and others.
The goal is simple and pragmatic: when your line is down and you are choosing who gets the next blanket order or VMI program, you should know exactly what to ask, what to measure, and how each network design will behave under real plant conditions.
Network optimization experts consistently describe distribution networks as strategic infrastructure rather than background plumbing. Alpine Supply Chain Solutions defines strategic network optimization as the periodic evaluation and redesign of the distribution footprint, inventory placement, and transportation strategy to improve cost, service, and resilience. Their project results commonly deliver about 10 to 15 percent total supply chain cost reduction, including examples where facility operating costs dropped by roughly 12 to 18 percent and fleet costs by about 3 to 5 percent after branch consolidation and smarter routing.
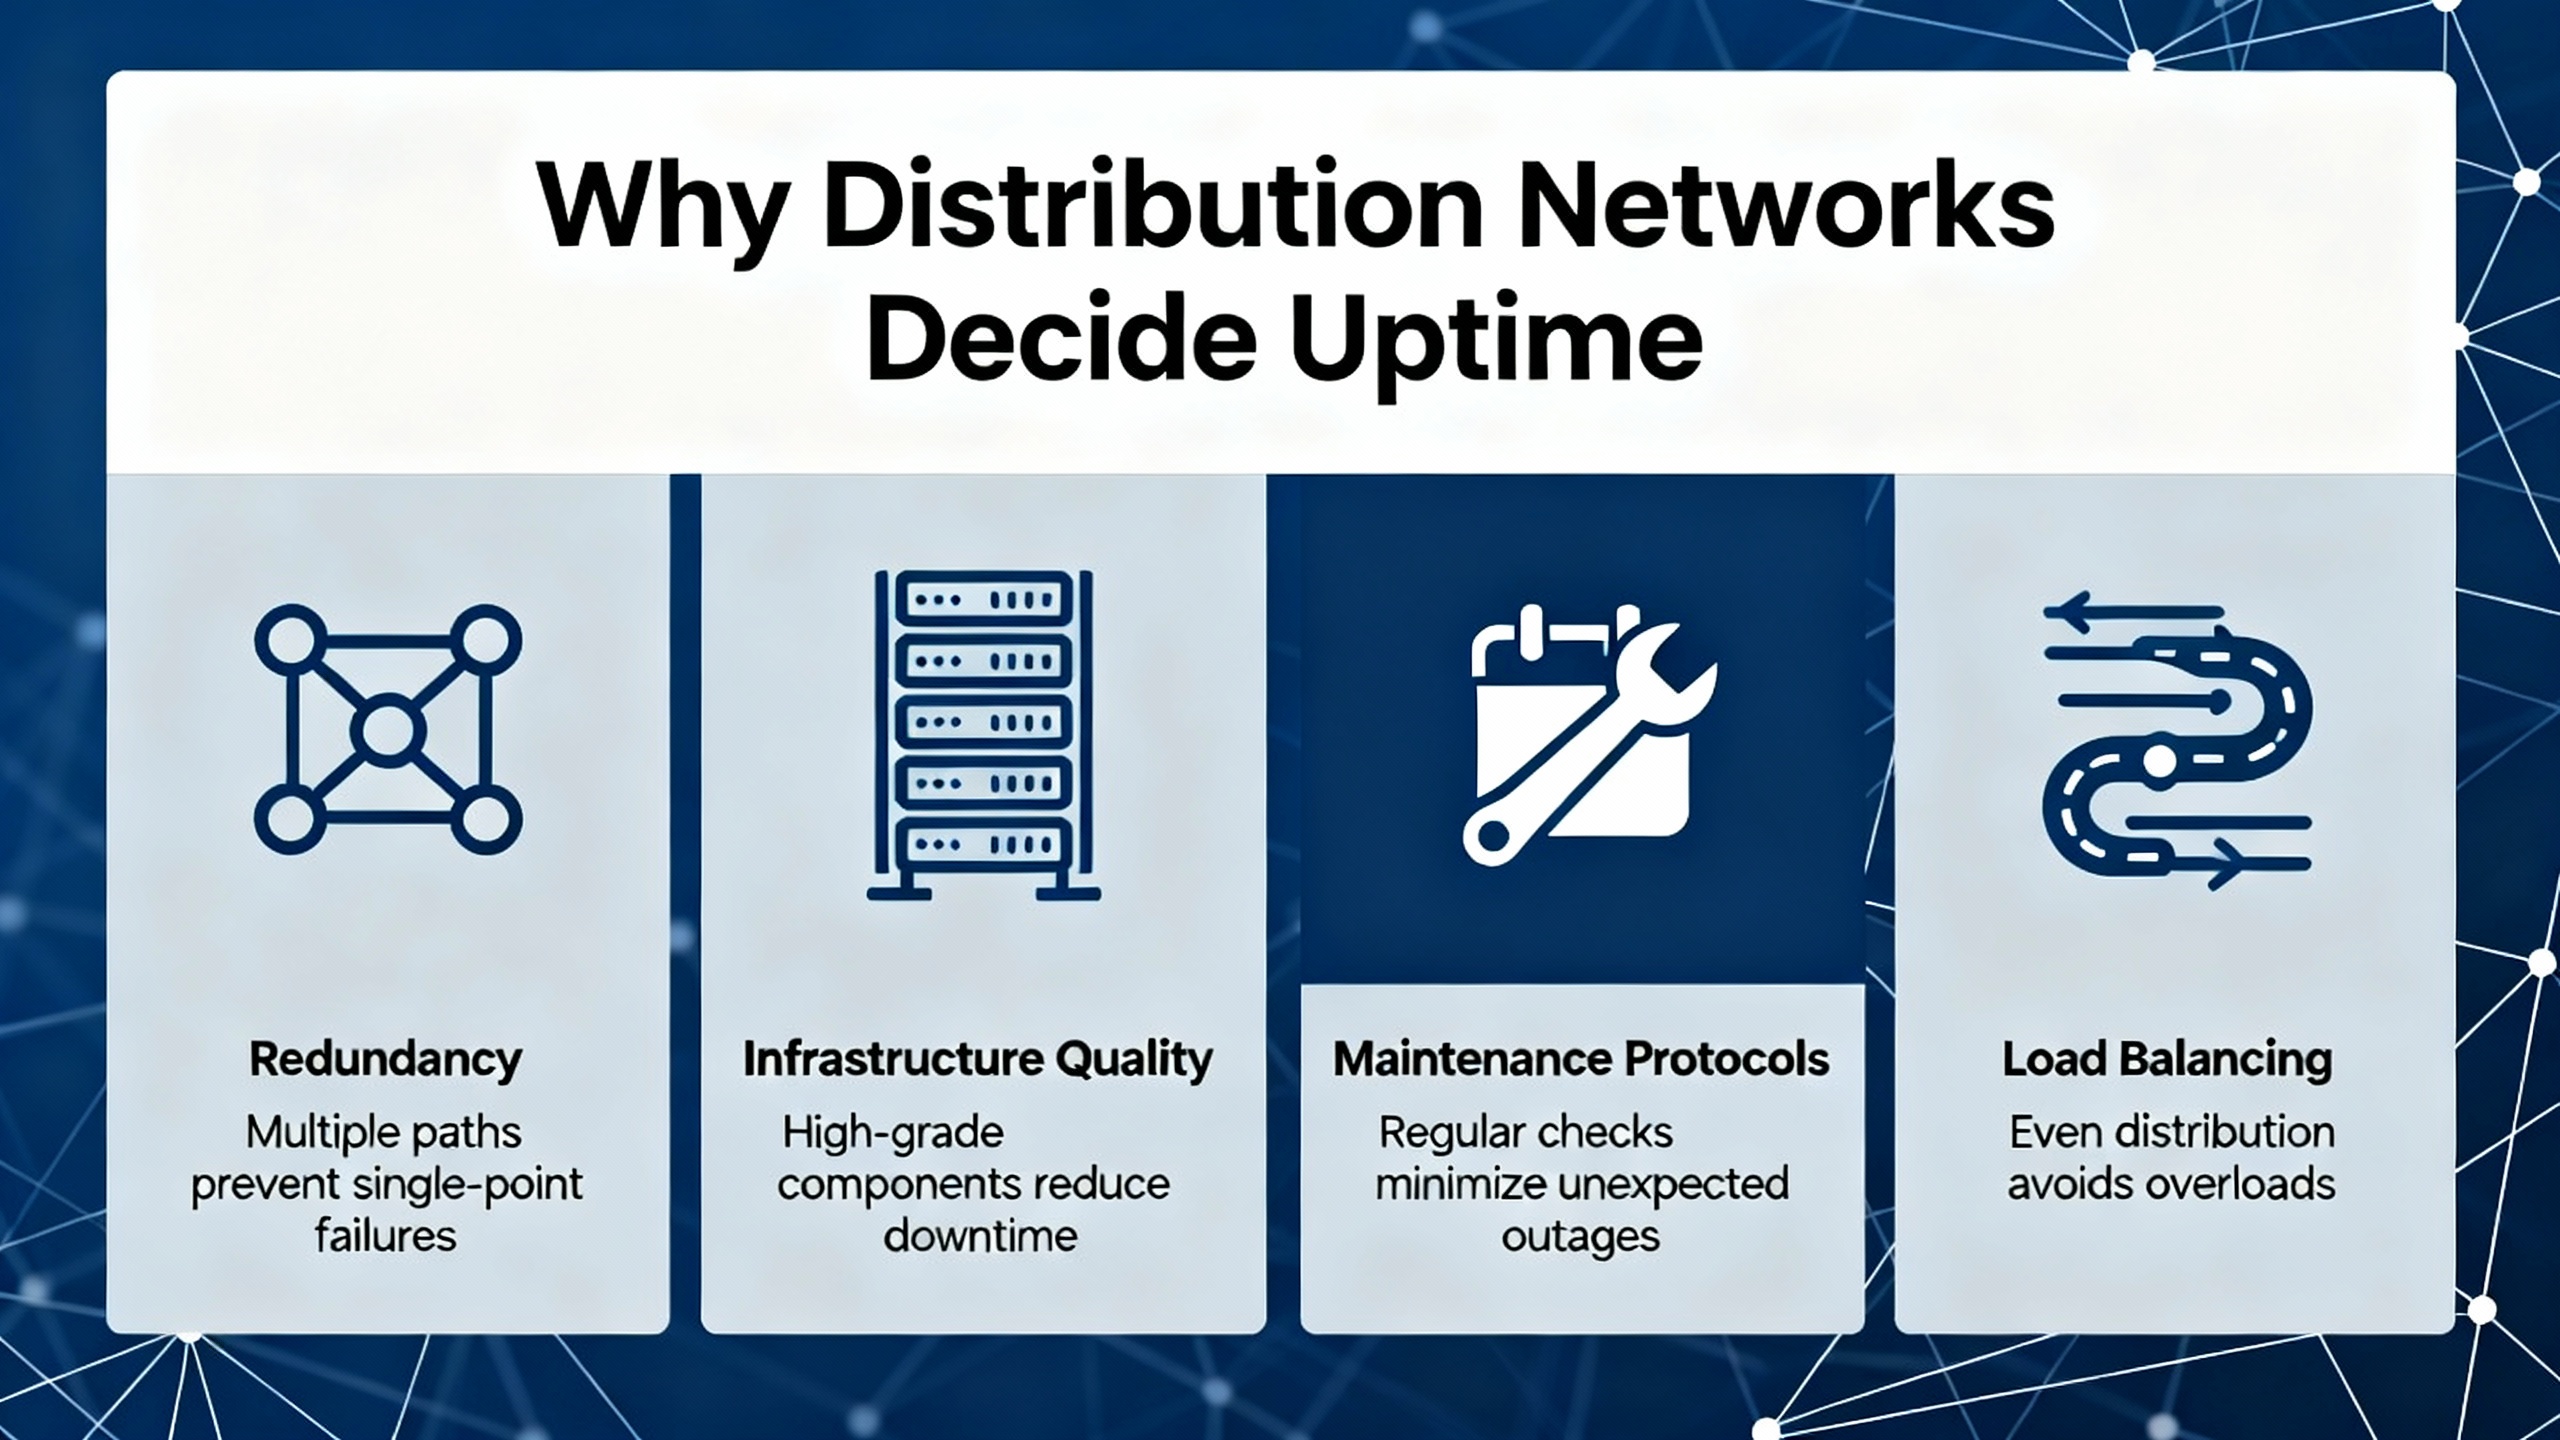
From an automation engineerŌĆÖs perspective, that same mindset translates into reduced downtime risk and faster recovery. A distributor with an optimized network is not just cheaper; it tends to be more predictable when the pressure is on. Key effects of a well-designed network include shorter and more reliable lead times, higher first-fill rates on common spares, and better performance during disruptions such as storms, strikes, or carrier capacity crunches.
Spendflo and FlexHub both emphasize that optimization is not a one-time design but a continuous cycle of analyzing demand, redesigning the network, and then rechecking performance. For a plant, this means the vendor that periodically rebalances warehouses, routes, and stocking rules will usually serve you better over the life of your equipment than one that treats the network as fixed.
When you compare Moore Automated and Grainger Industrial, you are really comparing two network philosophies in how they balance cost, service level, and risk. The right fit depends on your production profile, downtime costs, and how you want to split risk across suppliers.
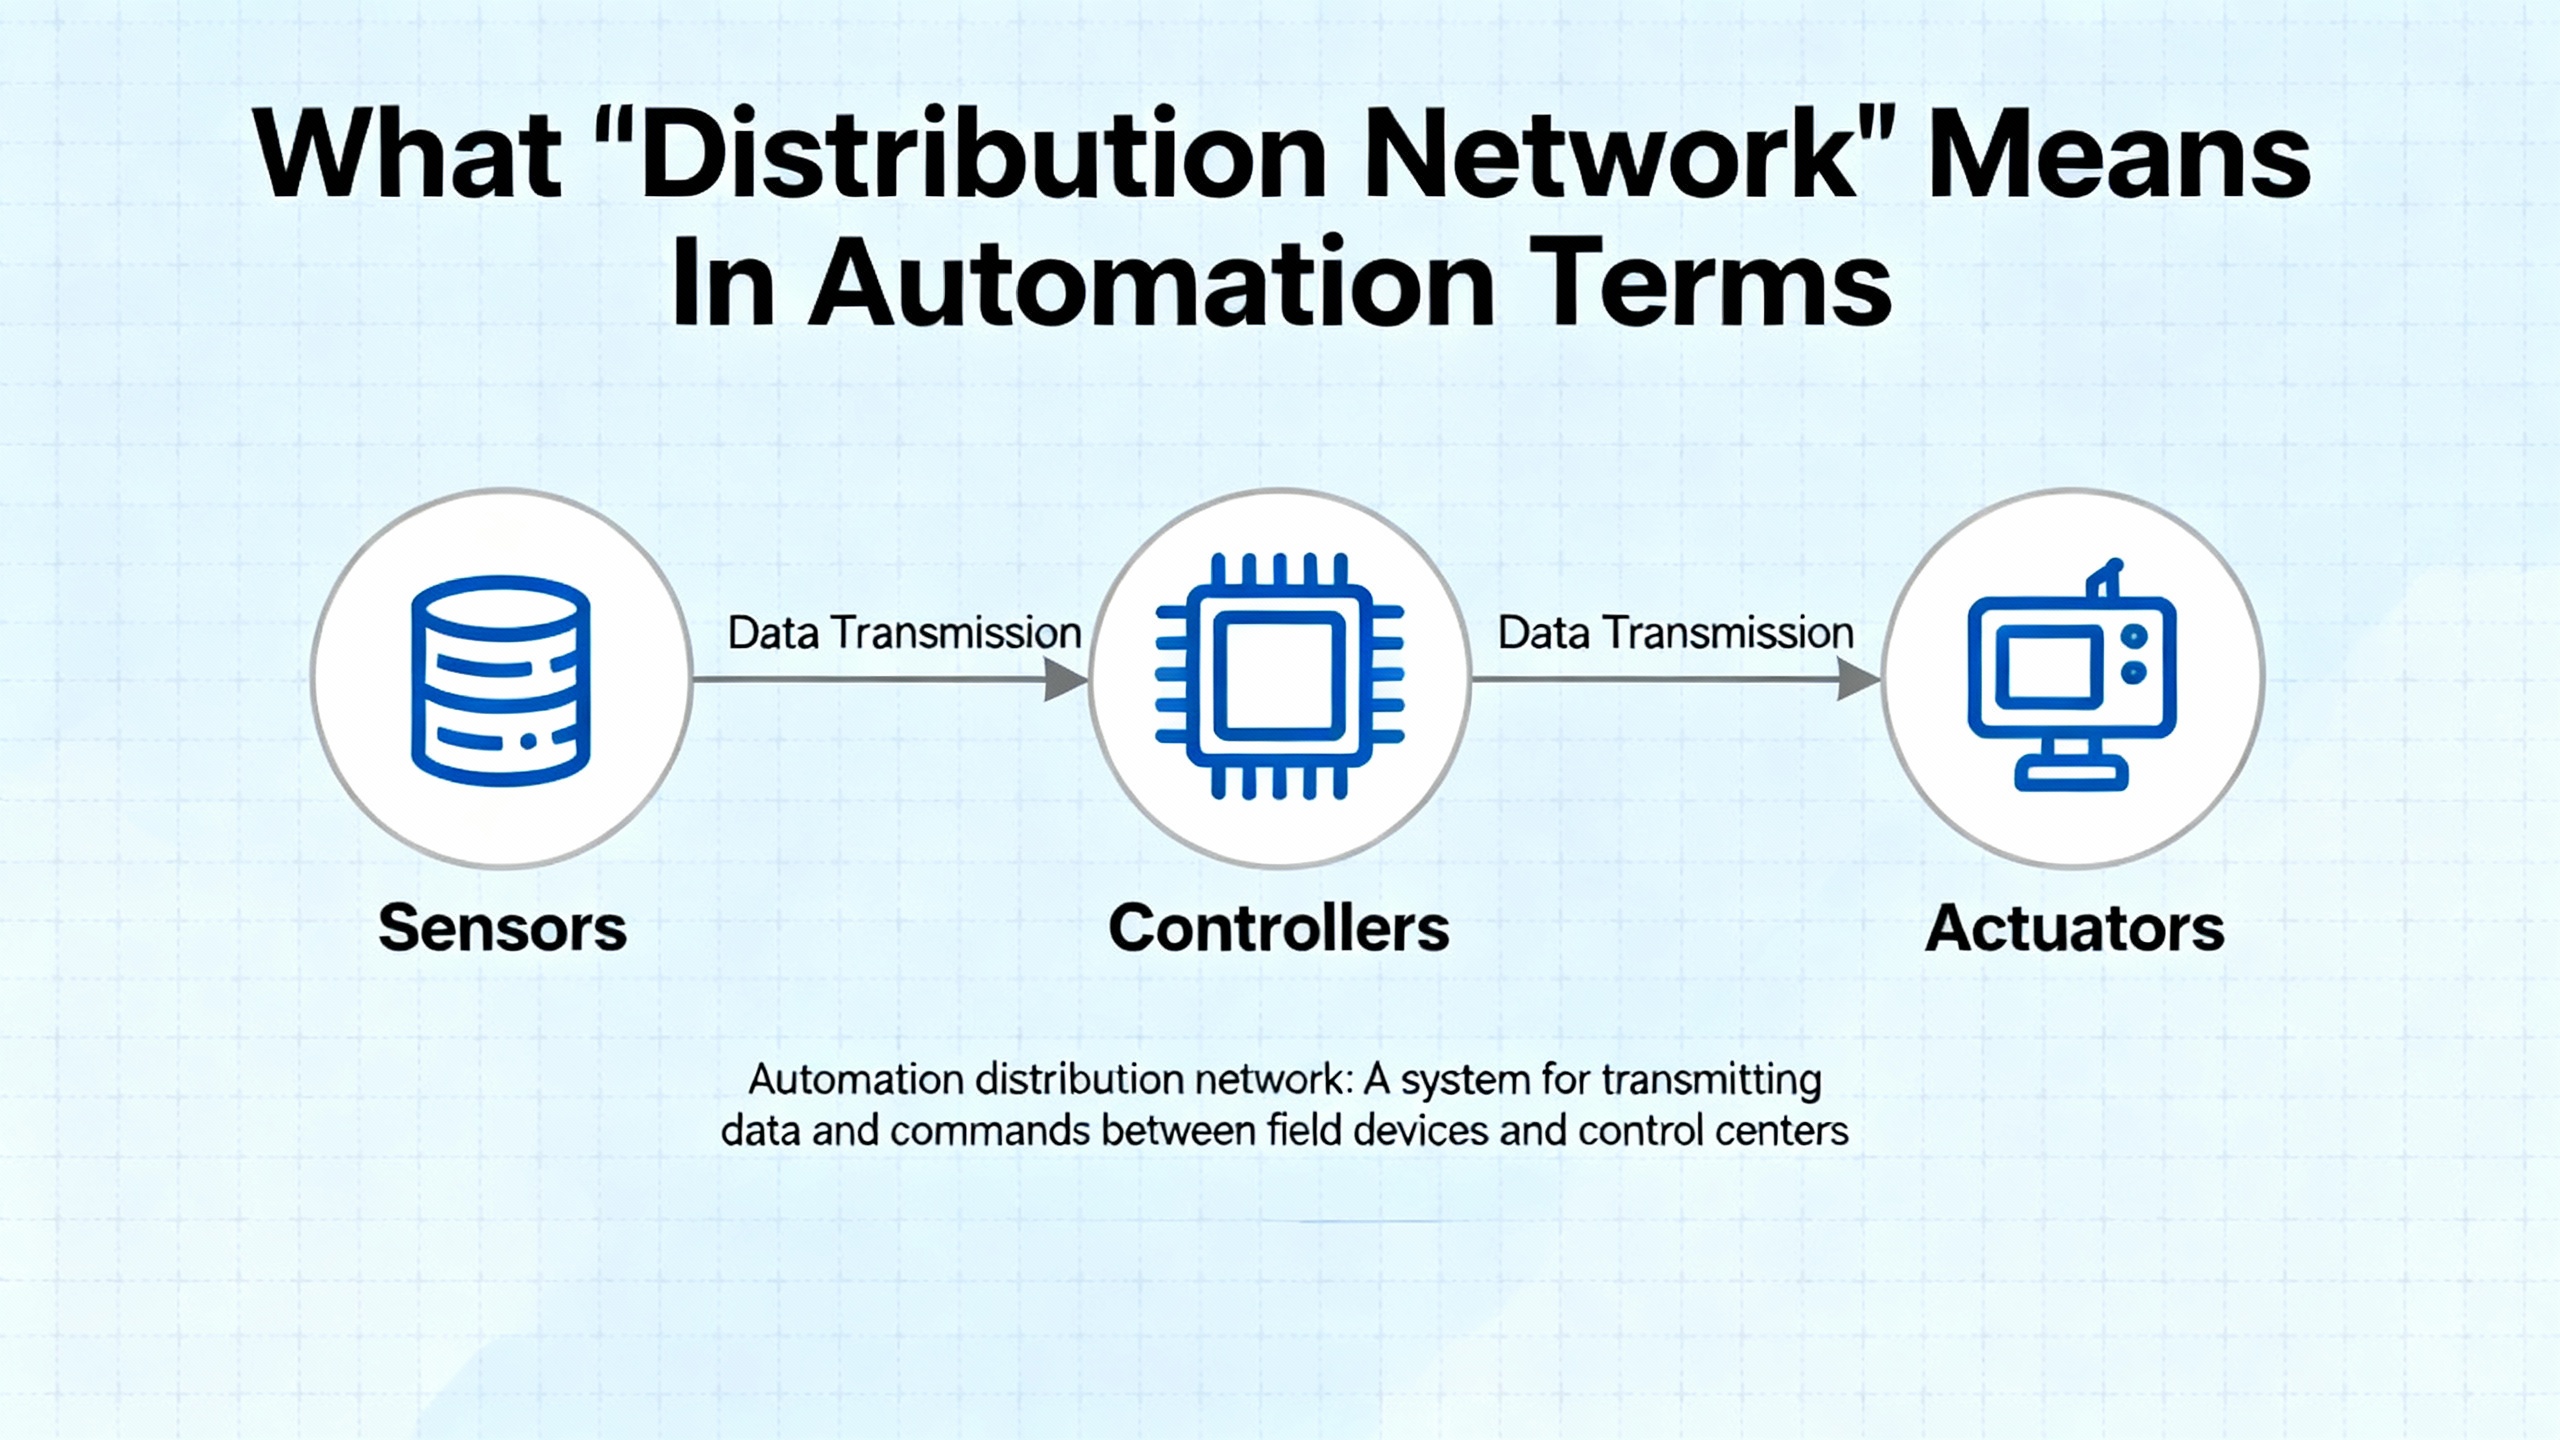
Supply chain specialists like ZINFI define distribution network optimization as the strategic improvement of routes, transportation modes, inventory locations, and partner channels to deliver products on time at the lowest sustainable cost. In industrial automation, that abstract definition becomes concrete in a few ways.
First, facilities and stocking points. This includes distribution centers, regional warehouses, and local branches that hold PLCs, I/O cards, HMIs, drives, safety relays, sensors, and panel hardware. Their locations relative to your plants determine ground transit time and the feasibility of same-day runs.
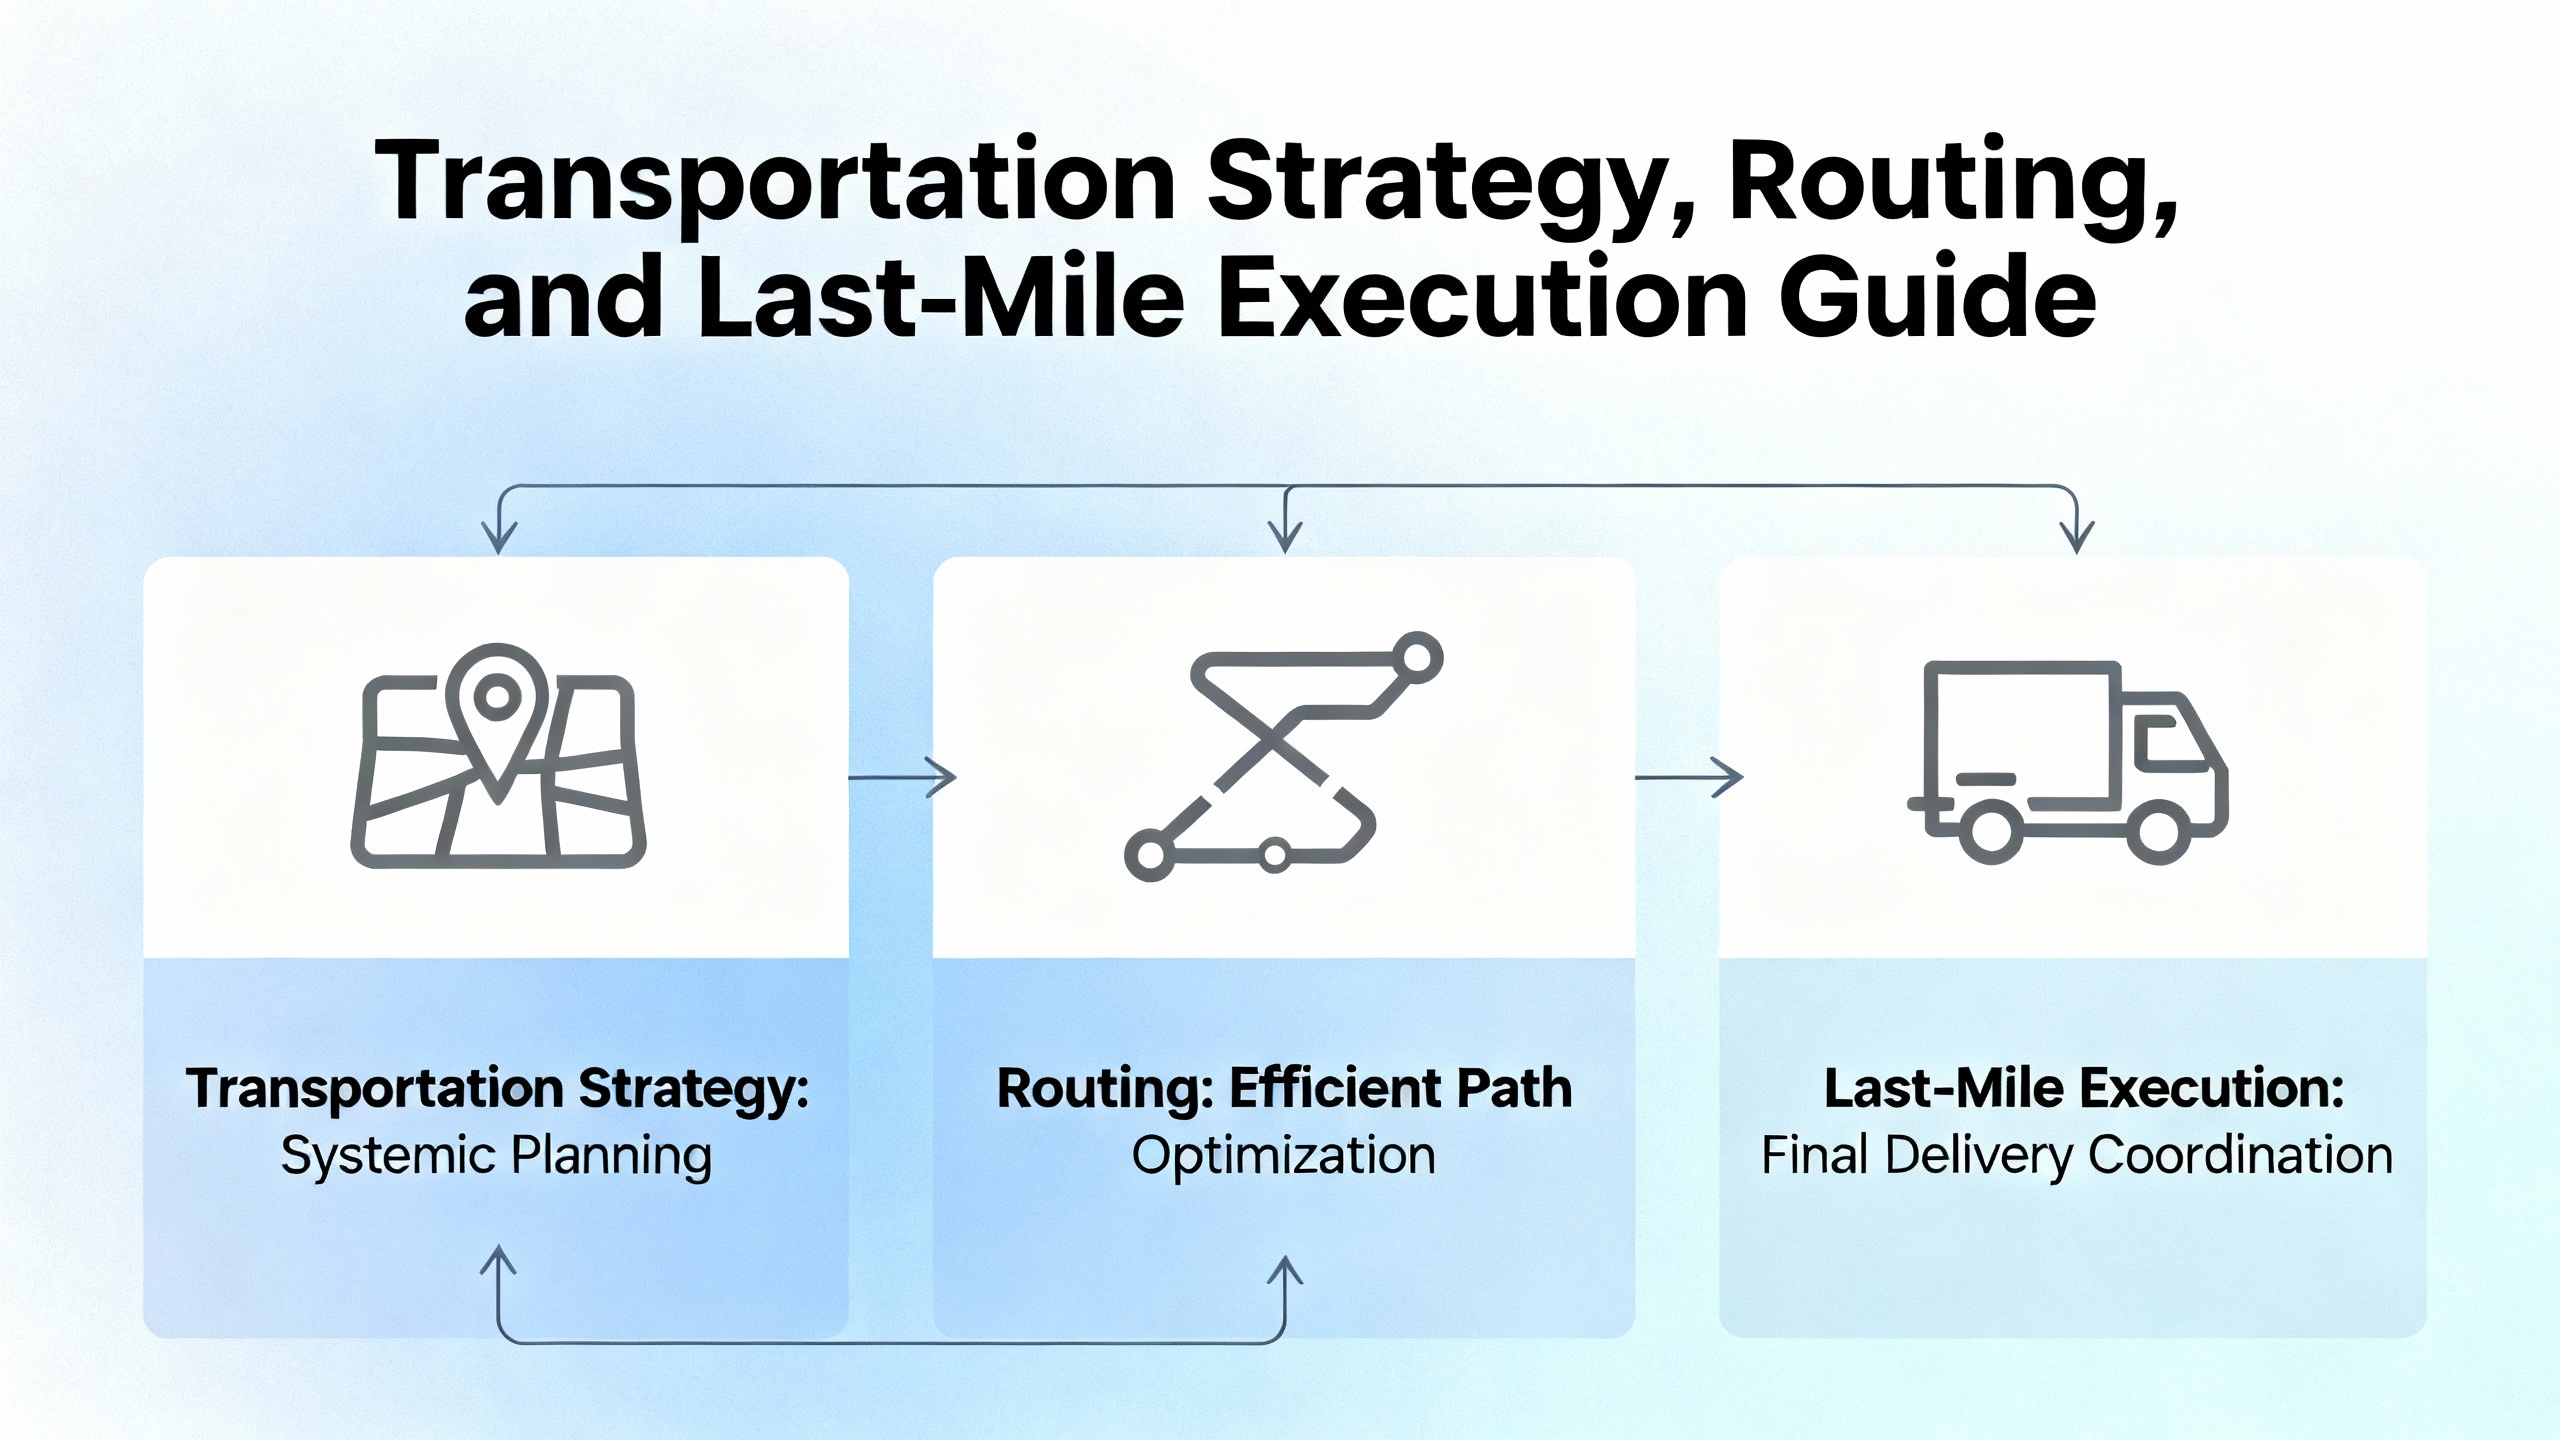
Second, transportation and routing. This covers how product moves between plants, warehouses, and last-mile carriers. FlexHub stresses the importance of transportation management systems that optimize mode selection, consolidation, and routing to reduce cost while sustaining delivery speed. For you, this affects cut-off times, partial shipments, and how often trucks actually arrive in your time window.
Third, inventory placement and policy. Alpine highlights the distinction between fast movers that should be regionally stocked and slow movers that can be centrally stocked. In automation, that might mean common sensors and circuit breakers in a nearby branch and specialized safety PLCs or high-end drives in a larger hub.
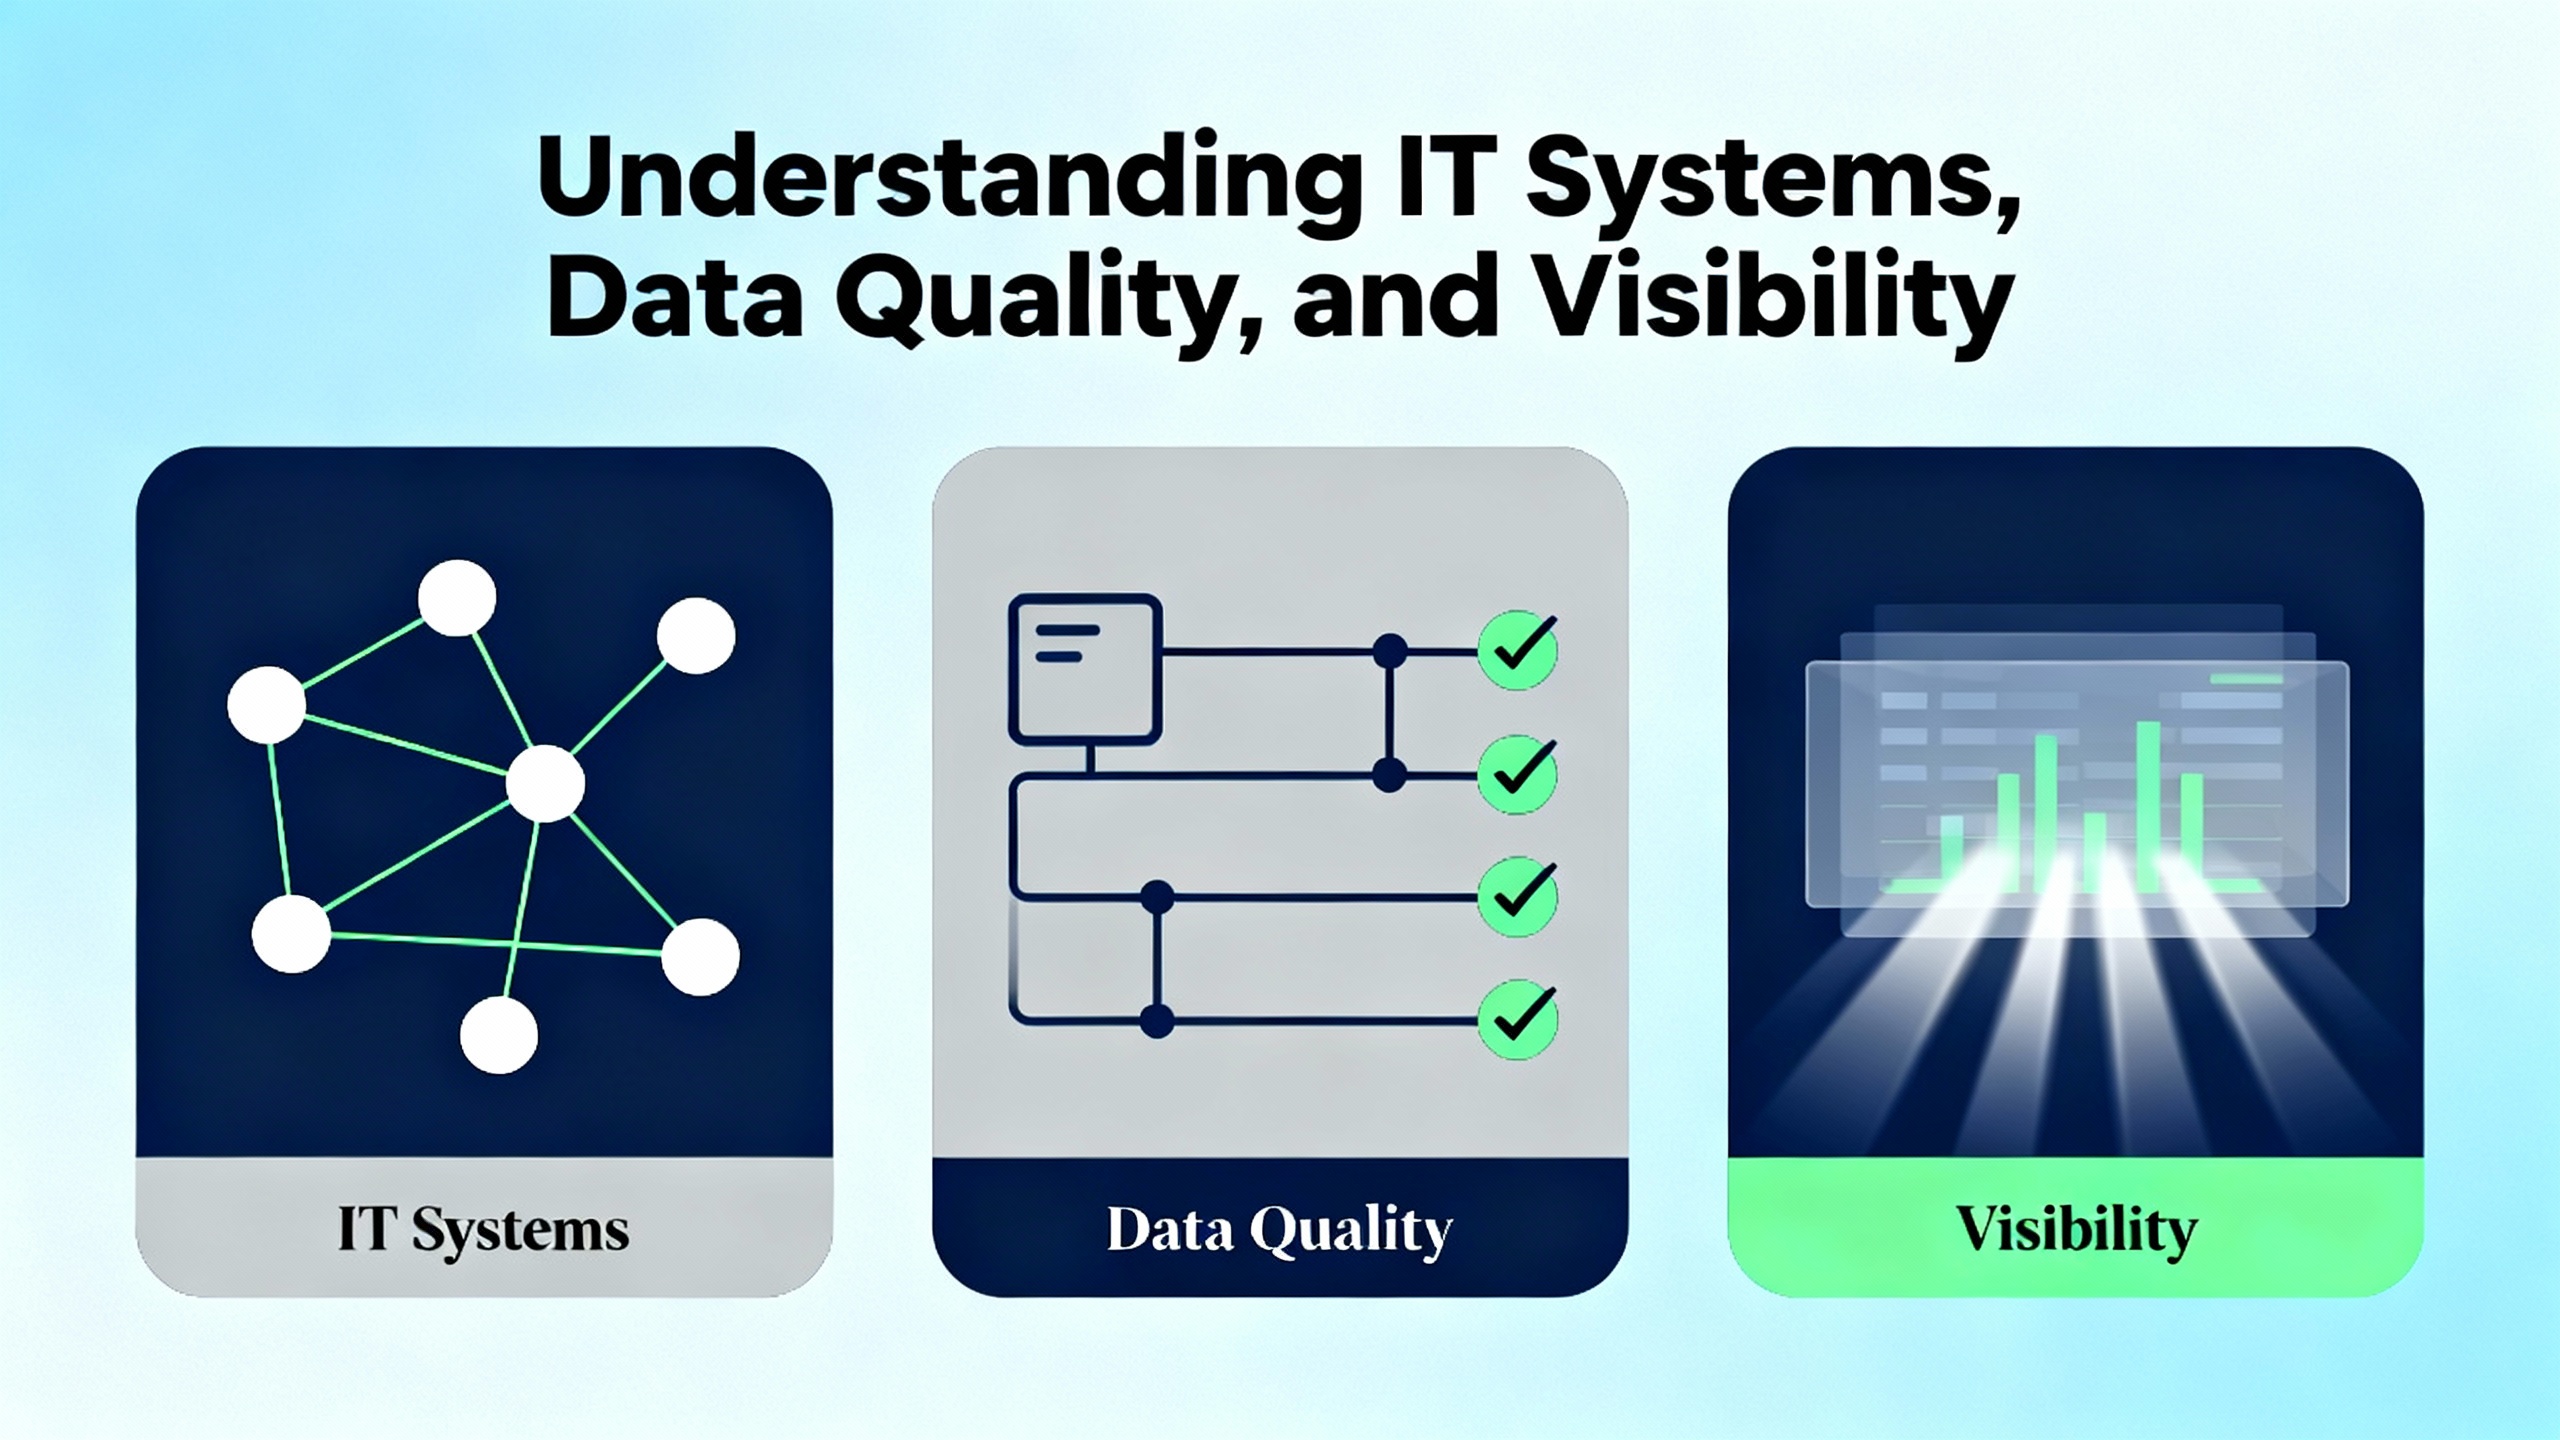
Fourth, data and IT backbone. Alpine and Sheer Logistics both call out systems such as WMS, TMS, ERP, and order management platforms that drive visibility and execution. A distributor with robust systems can give you accurate on-hand views, reliable promised dates, and consistent ASN and tracking data; a weak system forces you to operate blind.
Finally, partner network and collaboration. ZINFIŌĆÖs perspective on partner relationship management in channel distribution translates here into how well the distributor coordinates with OEMs, 3PLs, and carriers to cover gaps, manage backorders, and reroute supply when something breaks in the chain.
When you compare Moore Automated and Grainger Industrial, those are the building blocks you are really weighing, even if you normally just see them as ŌĆ£stock availabilityŌĆØ and ŌĆ£freight chargeŌĆØ on a quote.
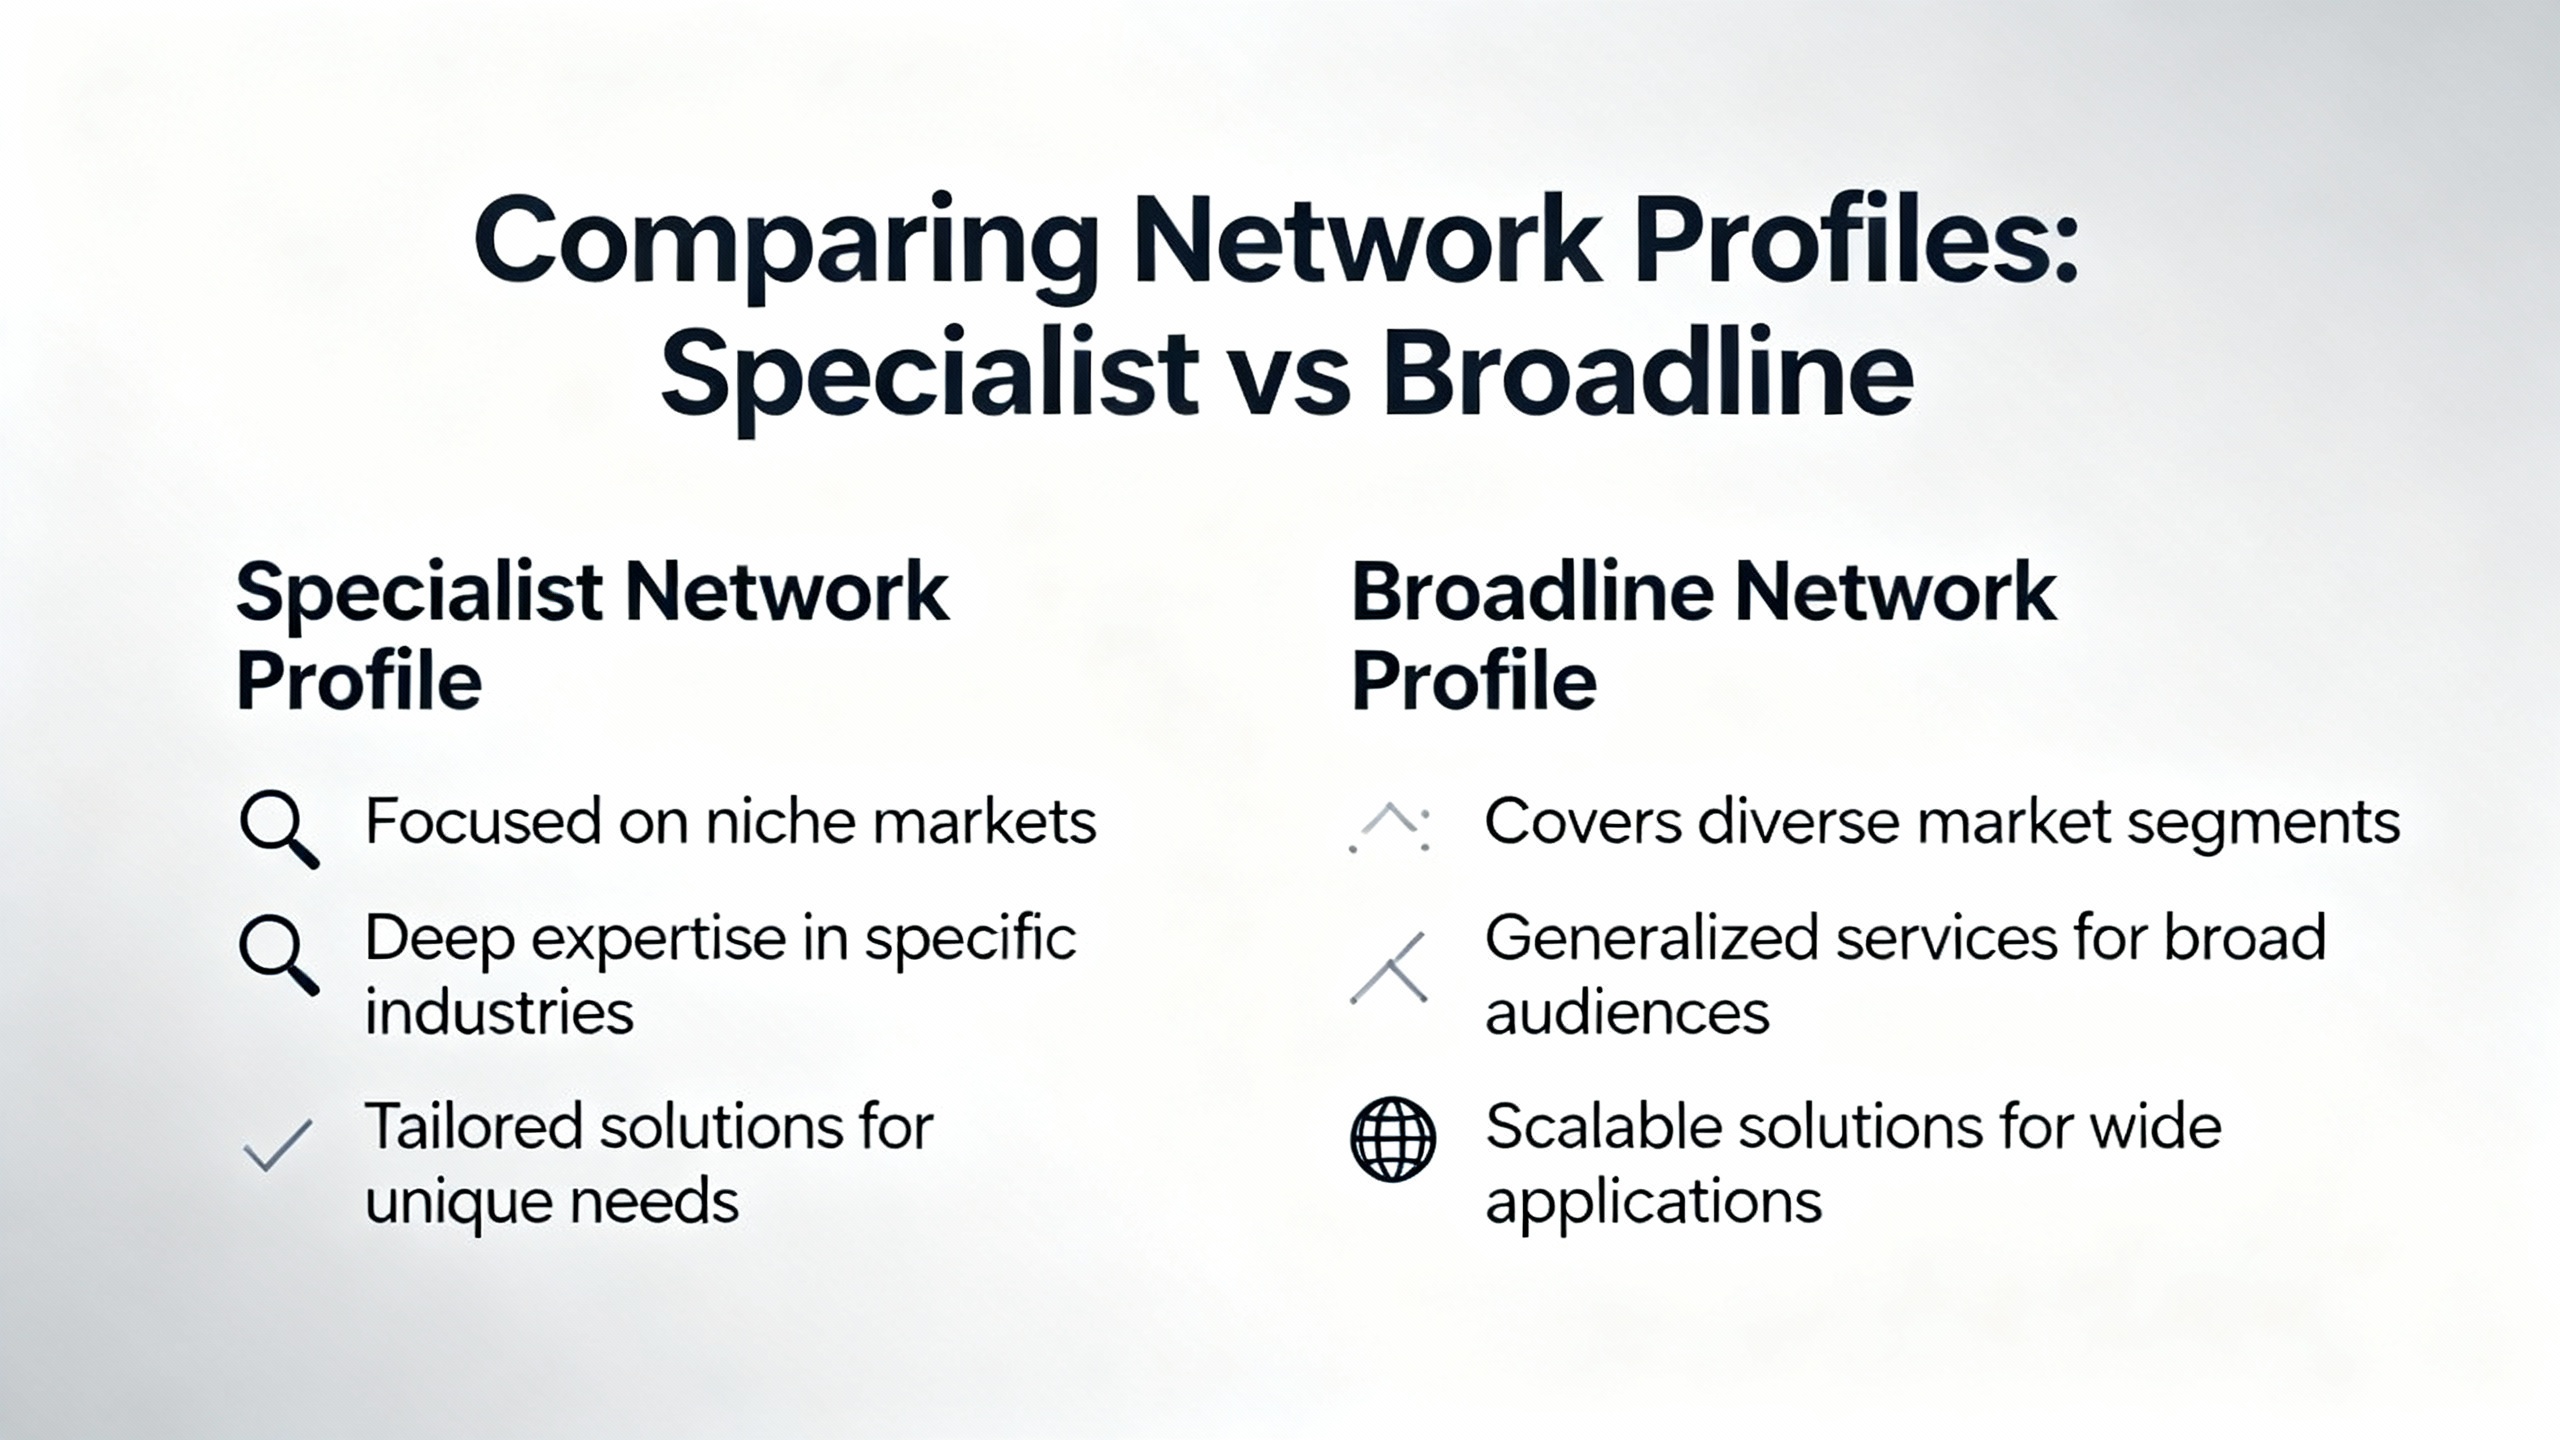
Because actual proprietary network maps are not public, it is more useful to compare profiles. For most plants, Moore Automated plays the role of automation-focused specialist, and Grainger Industrial functions as a broadline MRO distributor. The table below frames how those profiles often differ from a distribution network point of view. The details in your territory may vary, so treat this as a starting template and verify locally.
| Dimension | Automation specialist profile (Moore AutomatedŌĆōtype) | Broadline MRO profile (Grainger IndustrialŌĆōtype) |
|---|---|---|
| Core focus | Controls, automation, motion, safety, panels | Very broad MRO, from fasteners to PPE to some controls |
| Network intent | Depth and reliability on automation SKUs; support for projects and retrofits | Breadth, scale, and general availability across many categories |
| Inventory emphasis | Higher depth on PLCs, HMIs, drives, I/O, safety, branded automation lines | Wide catalog, often with more vendor drop-ship and variable depth on niche automation items |
| Services | Technical support, engineering assistance, startup support, panel services | Standardized fulfillment, e-commerce, sourcing, with some technical support capabilities |
| Typical risk posture | Will invest more in stocking critical automation items close to core markets | Will optimize stocking based on overall demand across all MRO categories |
This comparison does not claim specific warehouse counts or exact SKU strategies for either company. It simply reflects patterns many plants see when dealing with a specialist automation distributor versus a broadline industrial supplier. The rest of the article focuses on how to interrogate each of these profiles using solid network optimization thinking.
Alpine Supply Chain Solutions and FlexHub both emphasize that service level expectations drive facility count and placement. If customer promises require short delivery windows, networks add more regional nodes and place inventory closer to demand. If cost takes precedence over speed, networks consolidate into fewer hubs.
On a plant floor, service level is not an abstract KPI; it shows up as mean downtime per incident. For critical automation spares, your useful service level metric is whether the distributor can routinely deliver within the window that prevents a delayed restart.
When you compare Moore Automated and Grainger Industrial, pay close attention to where they actually hold the parts you care about. Do not stop at ŌĆ£we have a warehouse in your state.ŌĆØ Ask about which facility stocks your PLC family, your safety relays, your network switches, and your specialty sensors. For each, understand whether stock is in a branch within driving distance, a regional hub a day or two away, or a vendor facility several days out.
FlexHub points out that strategic warehouse placement near major customer hubs materially shortens shipping distances and enables faster last-mile delivery. In practice, if Moore Automated has a smaller but closer automation-focused warehouse stocking your PLC platform, it may out-perform a much larger but more distant general DC that Grainger Industrial uses for the same SKU.
Resist relying on averages. The only service level that matters is for your plant, for your top downtime drivers. That means you should line up your incident history with each distributorŌĆÖs stocking locations and transit times, and then challenge them to show how their footprint supports your specific risk profile.
AlpineŌĆÖs guidance on inventory placement is straightforward: fast movers belong close to demand, slow movers can be centralized. In controls and automation, fast movers usually include photoelectric sensors, common contactors, basic circuit breakers, standard safety relays, and common IO modules. Slow movers tend to be specialized safety PLCs, high-horsepower drives, unusual network modules, and spares for older or niche platforms.
Specialist distributors like the Moore Automated profile often treat automation SKUs as central to their network optimization problem. They invest more working capital in depth on those fast movers, and they build replenishment rules using demand forecasting and ABC analysis, similar to what FlexHub and Spendflo describe. That can give you higher first-fill rates for the items that most often trip your equipment.
Broadline distributors like the Grainger Industrial profile usually optimize inventory across their entire MRO portfolio. Their algorithms focus on aggregate demand across categories and across many customers. That is powerful for cost and general availability, but a specific automation spare that is critical to you may look like a slow and expensive line on their aggregate model and therefore be kept more centrally or ordered via vendor drop-ship.
Spendflo notes that one of the core benefits of network optimization is freeing working capital by aligning stock with real demand and cutting unnecessary inventory. From a plant perspective, that is only beneficial if your demand data actually informs the distributorŌĆÖs forecast. A practical action is to share your usage history and downtime-critical BOMs with both Moore Automated and Grainger Industrial and ask them to demonstrate how they would tune inventory policies for you. Look for whether they will create customer-specific stocking profiles or only rely on global averages.
Transportation is where theoretical network designs either shine or fail. FlexHub emphasizes the role of transportation management systems in choosing modes, consolidating shipments, and leveraging cross-docking and multi-modal transport to cut cost while preserving delivery performance. Alpine also ties transportation choices directly into network optimization outcomes.
On the plant floor, this shows up as how reliably the promised truck arrives before your maintenance window closes. It also determines whether partial shipments are common, whether late-day emergency orders actually leave a warehouse that night, and whether a distributor has the flexibility to arrange hot-shot deliveries for true emergencies.
Ask both Moore Automated and Grainger Industrial how they manage transportation on the lanes that serve your plant. You want to know whether they are using shipment consolidation that might delay a is-needed-now order, whether they have cut-off times that realistically match your shift schedules, and how they handle peak season capacity constraints. FlexHub also highlights shipment consolidation and cross-docking as levers. Those levers can lower costs but can also work against you if they introduce delay between a part leaving a warehouse and being loaded onto the local delivery route.
Sheer Logistics discusses future trends where AI, machine learning, and digital twins help design and test logistics strategies. Distributors that embrace these tools can find more efficient routing patterns and respond faster to disruptions. In a practical discussion with your sales or operations contact, ask them to walk you through how they plan and monitor their routes and what they do when a carrier fails to hit planned service levels.
Alpine and Sheer Logistics both stress that IT systems such as WMS, TMS, ERP, order management, and optimization engines are central to modern network optimization. They provide the data backbone necessary to design an efficient network and then actually run it.
For you, these systems matter because they determine whether you see the truth or a guess when you check availability. A distributor with robust systems can show real inventory by node, accurate estimated ship dates, and trustworthy lead times. One with weak integration gives you a generic ŌĆ£ships in two daysŌĆØ that may or may not survive contact with reality.
FlexHub and Spendflo highlight the role of analytics in predicting demand and monitoring performance. You can leverage that by asking both Moore Automated and Grainger Industrial what KPIs they track about your account: fill rates, on-time delivery, expedite frequency, line-item backorder rates, and so on. Then ask to see that data and to walk through the root causes and corrective actions when metrics dip.
From the research on electrical distribution networks, particularly the panoramic construction work published in ScienceDirect, there is a clear pattern: unifying data from multiple sources into a coherent graph model and using that for real-time analysis drastically improves reliability and reduces outage impact. Their results showed outage impact reductions around 20.3 percent once the topology and switching strategy were optimized. The exact algorithms differ, but the same principle applies to logistics. When a distributor is able to unify order, inventory, and transport data and simulate scenarios, it can redesign networks and routes that fail less often under stress.
In practical terms, ask how deeply the distributorŌĆÖs systems are integrated with carriers and with your plantŌĆÖs ordering channels. If all they can offer is email and a generic portal, they will struggle to optimize around your unique constraints. If they support EDI, APIs, and real-time tracking feeds, you can start to integrate their performance data into your maintenance planning and spares strategy.
Alpine notes that network optimization is often driven by risk management, regulatory changes, and external disruptions. Pharmaceutical distribution, for example, must cope with traceability rules such as the Drug Supply Chain Security Act and cold chain requirements, which forces continuous re-optimization. Similar pressures exist in industrial supply chains when new safety standards, trade rules, or local regulations affect certain product categories.
From a plant engineering point of view, resilience is the ability to still get parts when things go wrong. That could be a weather event that closes a regional hub, a labor dispute at a carrier, or a surge in demand caused by a major recall or retrofit across your industry.
Fortna positions its role as bridging the gap between strategy and execution to build resilient, agile, and efficient supply chains. That philosophy is a useful benchmark to test Moore Automated and Grainger Industrial against. Ask each of them how they handled recent disruptions in your region. Which warehouses or carriers did they pivot to, how did they communicate changes, and what did their performance metrics look like through the event?
The research on electrical distribution networks from AI Future School and related work shows that smart grid technologies, automated controls, and better topology planning can reduce energy losses by up to about 20 percent and significantly improve reliability. In the same way, distributors that invest in real-time monitoring, scenario planning, and automation in their networks reduce the ŌĆ£outageŌĆØ risk of stockouts and missed deliveries for your plant.
One key resilience lever is diversification. FlexHub suggests closer collaboration and shared assets between partners to increase asset utilization. In practical terms, you might deliberately keep both Moore Automated and Grainger Industrial active for different risk categories: one as your primary automation specialist with deeper stock, the other as a secondary source for more generic items and as a safety net when a particular node fails. The important part is that this diversification is designed, not accidental.
Alpine divides costs into variable components such as labor, utilities, material handling, equipment maintenance, transportation, and inventory holding, and fixed components such as leases, property taxes, insurance, and security. A distributorŌĆÖs network design is essentially a choice of how to balance those costs to meet target service levels.
For a plant, the question is not how cheaply the distributor runs its own network, but how that cost structure shows up in your total cost of ownership. If a network is optimized too hard for cost, it may shift risk to you in the form of longer lead times, more backorders, and more downtime exposure. If it is optimized too hard for service, you may pay higher unit prices and freight for performance that you do not actually need.
Spendflo notes that a key benefit of network optimization is visibility into cost structures so leaders can make better decisions. You can adopt that mindset by looking at your combined spend with Moore Automated and Grainger Industrial over a year and then overlaying downtime incidents, expedite charges, and emergency sourcing events. Often, a slightly higher price from a network that gives you fewer line-down events is a net win.
When you discuss contracts, move the conversation away from unit price alone. Push both distributors to commit to service metrics aligned with your plant risk: availability thresholds on named SKUs, maximum lead times by category, and response times for true emergencies. Then ask how their network must be structured to credibly hit those metrics and what that implies for cost. You want cost and network design to be transparent tradeoffs, not surprises.
If you want to evaluate Moore Automated and Grainger Industrial rigorously without turning into a full-time supply chain consultant, you can still apply the core ideas that Alpine, FlexHub, Spendflo, and others advocate.
Start by mapping your demand. Pull at least several months of purchase history for automation-related SKUs and tag each item as downtime critical, important but not critical, or convenience. This is not about perfect classification; it is about knowing where downtime risk really sits in your BOM.
Next, overlay supplier footprint. For every downtime-critical item, identify where each distributor actually stocks it, not just where they say they can get it. Capture typical transit times and cut-off times for those lanes. You now have a simple network map focused on your real risk hotspots.
Then, visit or virtually tour their facilities where practical. FlexHub emphasizes that many bottlenecks are in process, not only in layout. On-site, you can see whether outbound staging is chaotic or disciplined, whether automation supports picking and packing, and whether emergency orders are treated with urgency.
After that, talk data. Ask each distributor for historical fill rates, on-time delivery, and backorder statistics for your account. Bring those into a single view and compare them against your incident log. You will quickly see whether claims align with reality.
Once you have that picture, run a few scenarios. For example, imagine a major failure on your highest-risk packaging line and walk through exactly how each distributor would fulfill a multi-line emergency order. Consider holidays, weekends, and carrier capacity constraints. The research from Spendflo suggests that scenario planning is a core practice in robust network design; you are simply applying it at the plant-vendor interface.
Finally, convert findings into commitments. Use what you have learned to negotiate stocking agreements, local cache inventories, or consignment for the handful of parts where downtime cost dwarfs carrying cost. Make sure those commitments are tied back to the distributorŌĆÖs network in a way that is technically feasible for them; otherwise you will be chasing broken promises.
Several themes from broader distribution and electrical network optimization research are directly applicable to your Moore Automated versus Grainger Industrial decision.
One theme is periodic re-evaluation. Spendflo recommends formally reevaluating supply chain networks at least every year or two, with triggered reviews after major demand or market changes. In automation terms, this means you should not lock into one distributor forever based on a quote from years ago. After plant expansions, platform migrations, or major supply disruptions, revisit whether your current distributor mix still aligns with your needs.
Another theme is data-driven modeling. The panoramic topology construction work in ScienceDirect shows the power of unifying multi-source data, simplifying the model into a backbone plus branches, and then optimizing switch placement to minimize outage impact. You can use a conceptual analog: treat your plant demand as the backbone, treat each distributorŌĆÖs nodes and routes as branches, and then tune which distributor carries which risk segment so that the combined network behaves reliably.
A third theme is collaboration over isolation. ZINFIŌĆÖs work on partner ecosystems and FlexHubŌĆÖs emphasis on supplier collaboration both point to the value of sharing data, forecasts, and constraints. When maintenance, engineering, procurement, and the distributor all see the same demand and risk picture, it becomes possible to design stocking and routing that works for everyone. If each party optimizes in isolation, the network suffers.
A final theme is that technology amplifies but does not replace fundamentals. AI Future School and Sheer Logistics both highlight advanced analytics, AI, and machine learning. Those tools matter, but only when the underlying data is clean, the processes are stable, and the objectives are clear. In the automation world, a distributorŌĆÖs fancy portal is worth little if they cannot reliably hold and ship the parts that keep your line running.
In automation and controls, a good service level is one that keeps downtime within tolerable limits at a sustainable cost. It is less about a generic percentage and more about consistent, predictable availability and lead times on the small set of parts that actually stop your lines. If your critical ten or twenty SKUs are almost always available within your required window, and you rarely need emergency workarounds, the service level is effectively good even if some noncritical items occasionally slip.
Concentrating spend can give you better pricing and more leverage for stocking commitments, but it also concentrates risk if that distributorŌĆÖs network fails under stress. Splitting across Moore Automated and Grainger Industrial lets you assign different roles: one as your primary automation specialist and the other as a backup or as a source for non-automation MRO. The right choice depends on your downtime risk tolerance, internal capacity to manage multiple suppliers, and the willingness of each distributor to invest in tailored stocking and service levels.
Drawing on recommendations from network optimization research, revisiting your choice about every one to two years is a sensible baseline, with additional reviews whenever you have a major plant change, such as adding a new line, migrating to a new PLC platform, or entering a new geography. After any significant disruption that stresses the supply chain, such as extreme weather or major carrier issues, a short postmortem comparing how Moore Automated and Grainger Industrial performed is also valuable.
When you strip away marketing language, the difference between Moore Automated and Grainger Industrial for a plant engineer is not about who has the slicker catalog; it is about whose distribution network best matches the way your lines fail and recover. Use the same optimization thinking that world-class supply chains and power grids rely on, test both networks against your real risk, and then reward the partner whose design actually protects your uptime.


Copyright Notice © 2026 mooreautomated.com All rights reserved,Moore Automated is not an authorized distributor or representative of the manufacturers featured on this website. Brand names and trademarks featured are the property of their respective owners.
Leave Your Comment