
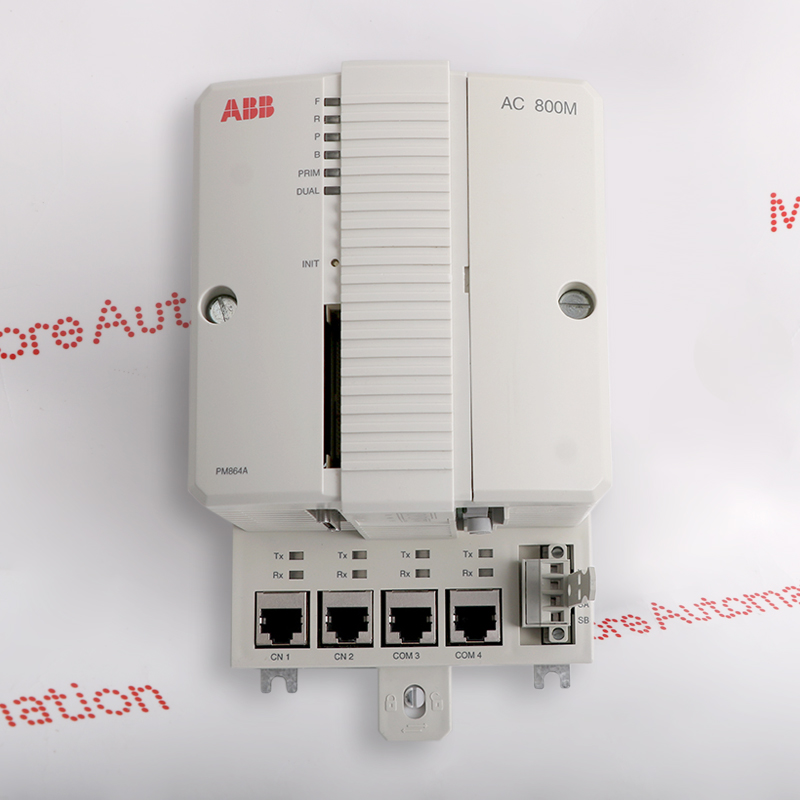
MP 3009X
Get A Quote
When a B&R controller in a running plant drops into service mode, reboots with a watchdog warning, or refuses to show up in Automation Studio, the pressure on site is real. As someone who has stood next to machines at 2:00 AM with operators waiting, I have learned that effective diagnostics on B&R systems is less about magic tricks and more about understanding how B&RŌĆÖs runtime, fieldbuses, and tools expose the information you need.
This article walks through a practical, endŌĆætoŌĆæend approach to B&R Automation PLC diagnostics, grounded in B&R Community case discussions, universityŌĆælevel overviews of B&R software, and fieldŌĆæproven patterns. The focus is on how to use B&RŌĆÖs own diagnostics (I/O datapoints, System Diagnostics Manager, logbooks, and Automation Studio) to troubleshoot cold restarts, bus issues, communication problems, and runtime errors without guesswork.
B&RŌĆÖs platform is intentionally integrated. A University of Minnesota overview of B&R PLC software describes how Automation Studio, a realŌĆætime operating system (Automation Runtime), motion, safety, and diagnostics sit in a single environment rather than being separate silos. The runtime not only executes IEC 61131ŌĆæ3 logic but also manages communication, synchronization, and diagnostics across PLCs, HMIs, drives, and safety devices.
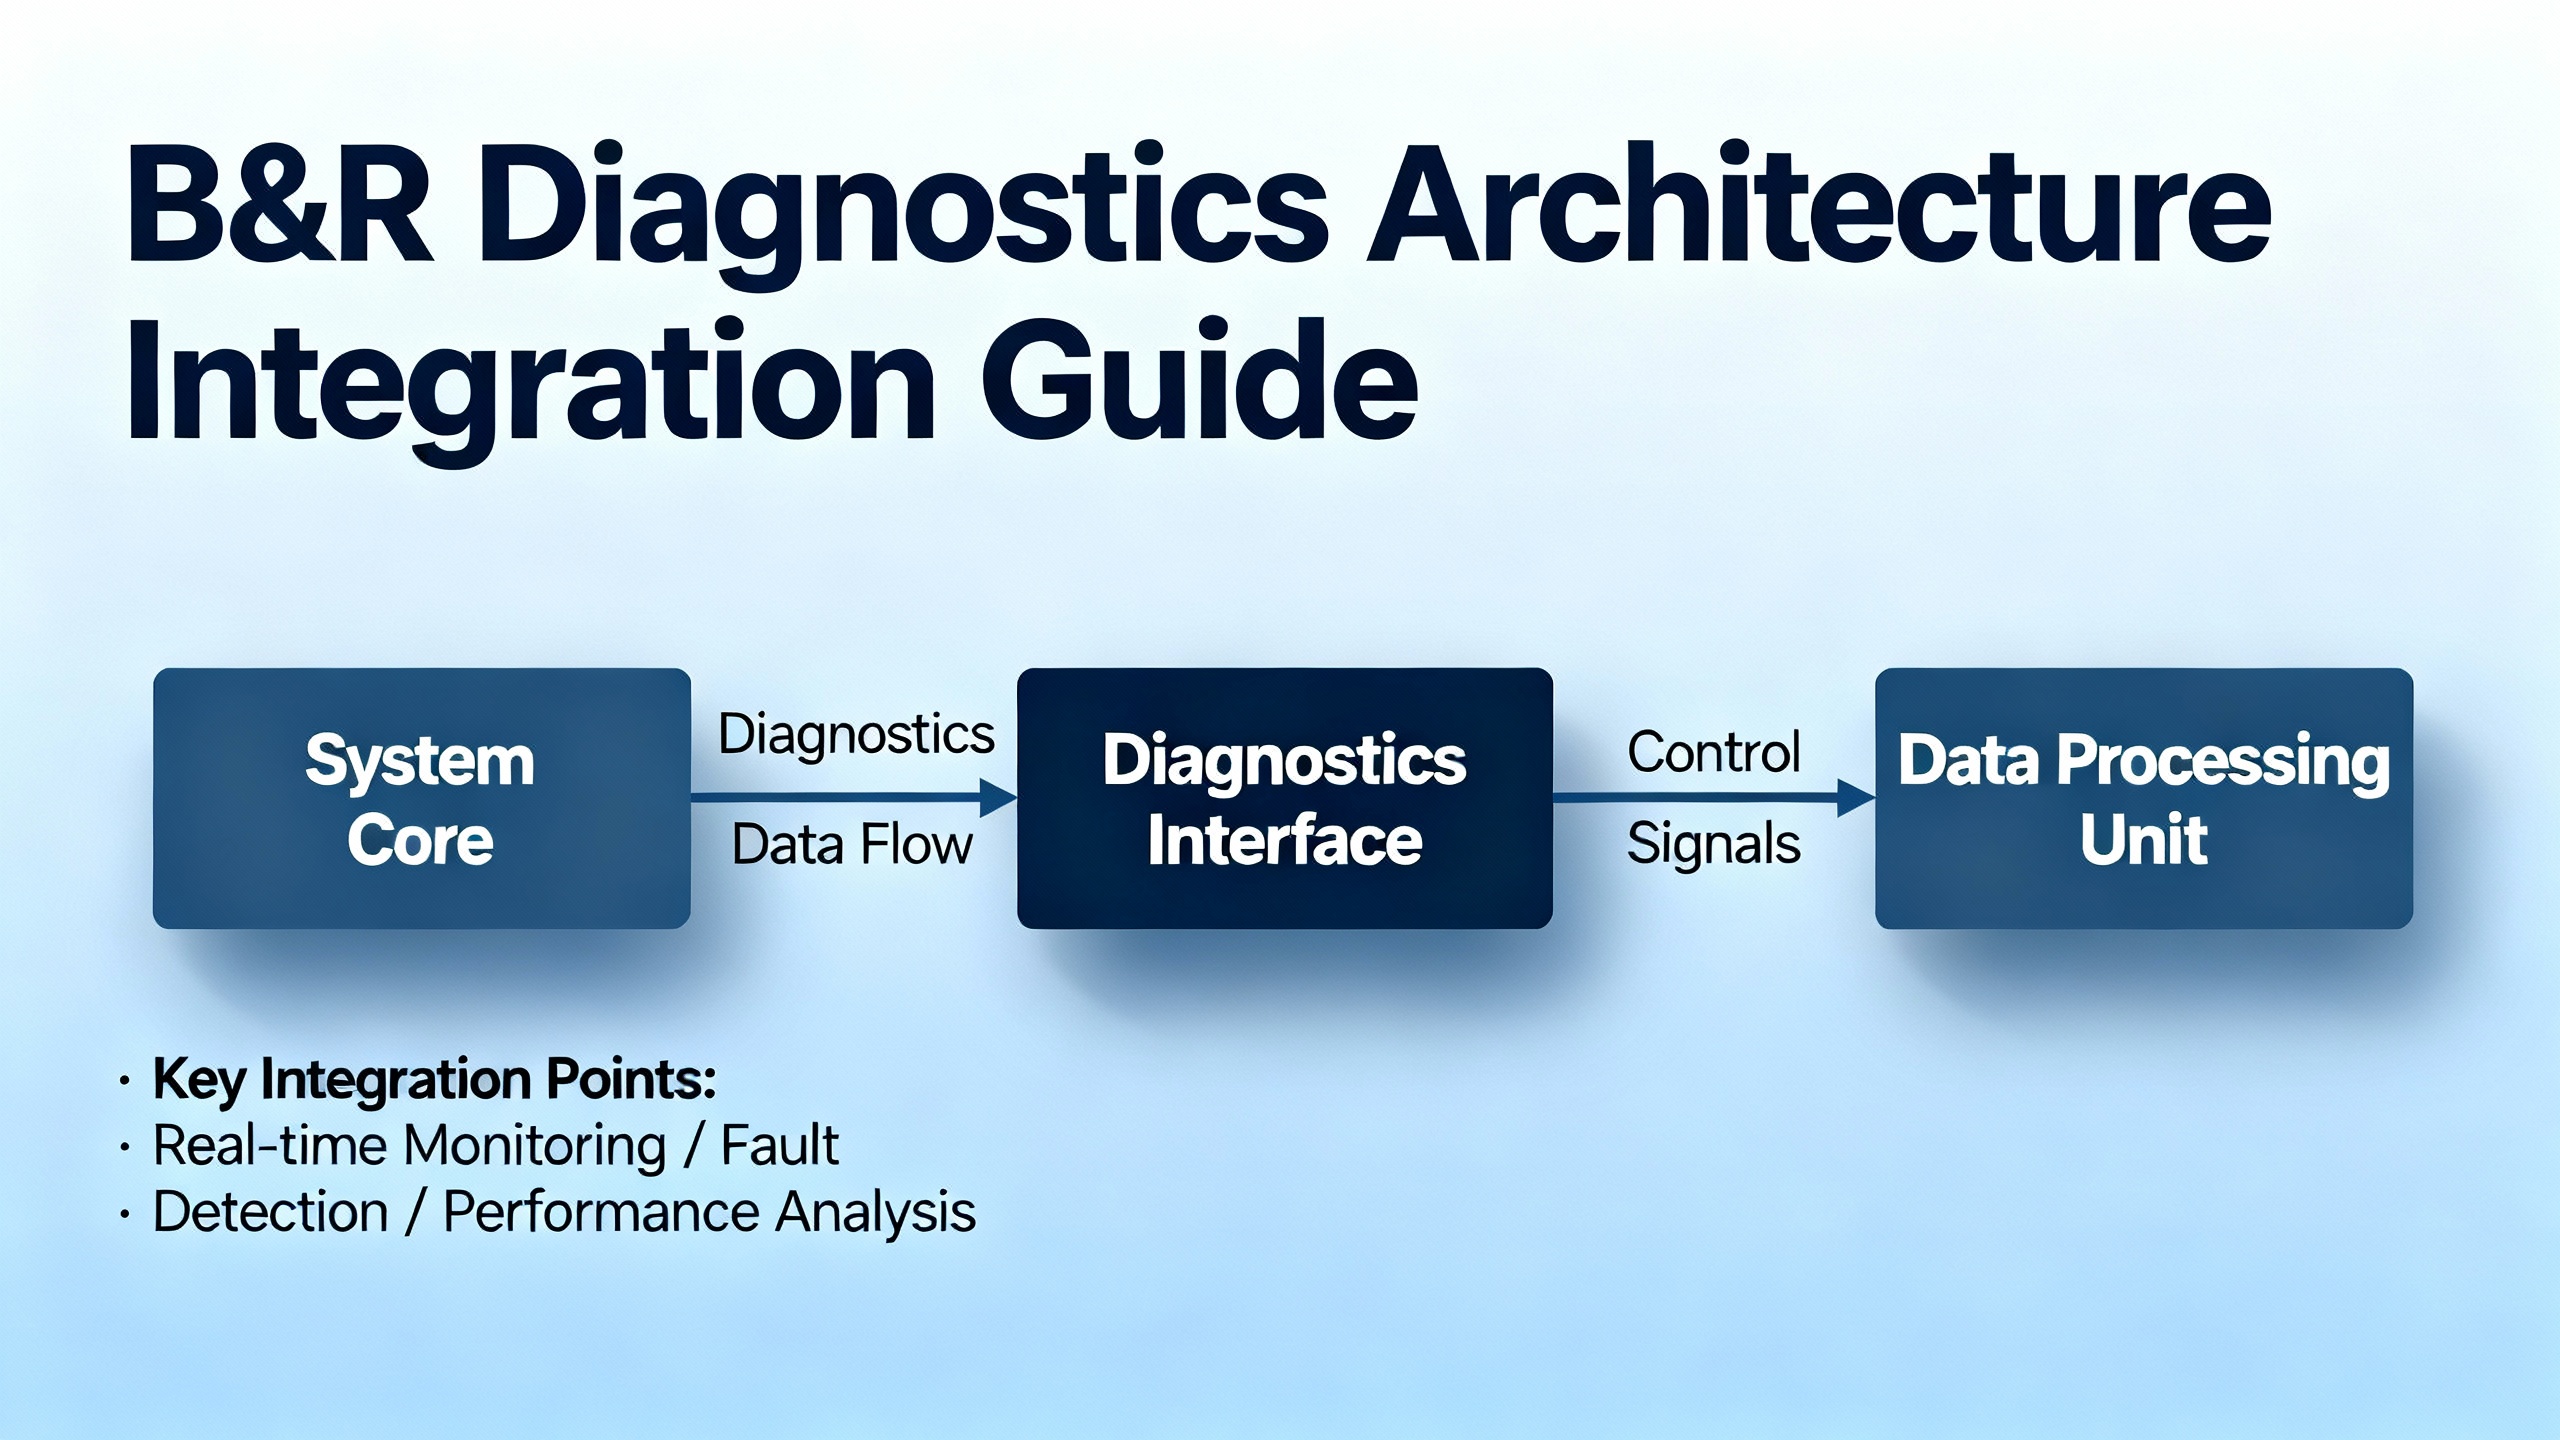
From a troubleshooting perspective, it helps to think in layers: the controller and runtime, the I/O modules and fieldbuses, and then the engineering and service tools that expose diagnostic data.
| Layer | Key components and tools | Diagnostic role |
|---|---|---|
| Controller and runtime | CPU (e.g., X20 or CP series), Automation Runtime RTOS | Task execution, watchdogs, critical error handling, service mode transitions, system logbook |
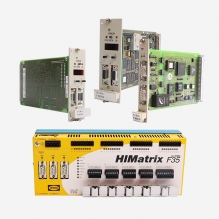
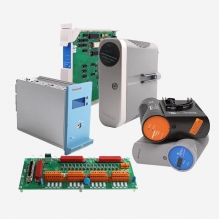
| I/O and fieldbuses | X20 modules, X2X bus, POWERLINK, power supply modules | ModuleOk, power status, bus health counters, channelŌĆælevel fault bits |
| Engineering and service | Automation Studio, PVI stack, System Diagnostics Manager (SDM), B&R Service Utility, Runtime Utility Center | Online monitoring, log extraction, system dumps, offline analysis, program transfer |
B&RŌĆÖs design means that a power supply module, a remote I/O drop, and the PLCŌĆÖs own webŌĆæbased SDM all contribute diagnostic datapoints that can be logged and correlated. When you leverage that structure instead of probing ŌĆ£blind,ŌĆØ the time from symptom to root cause drops sharply.
Before diving into datapoints, you need a clean mental model of how the controller behaves when it is unhappy.
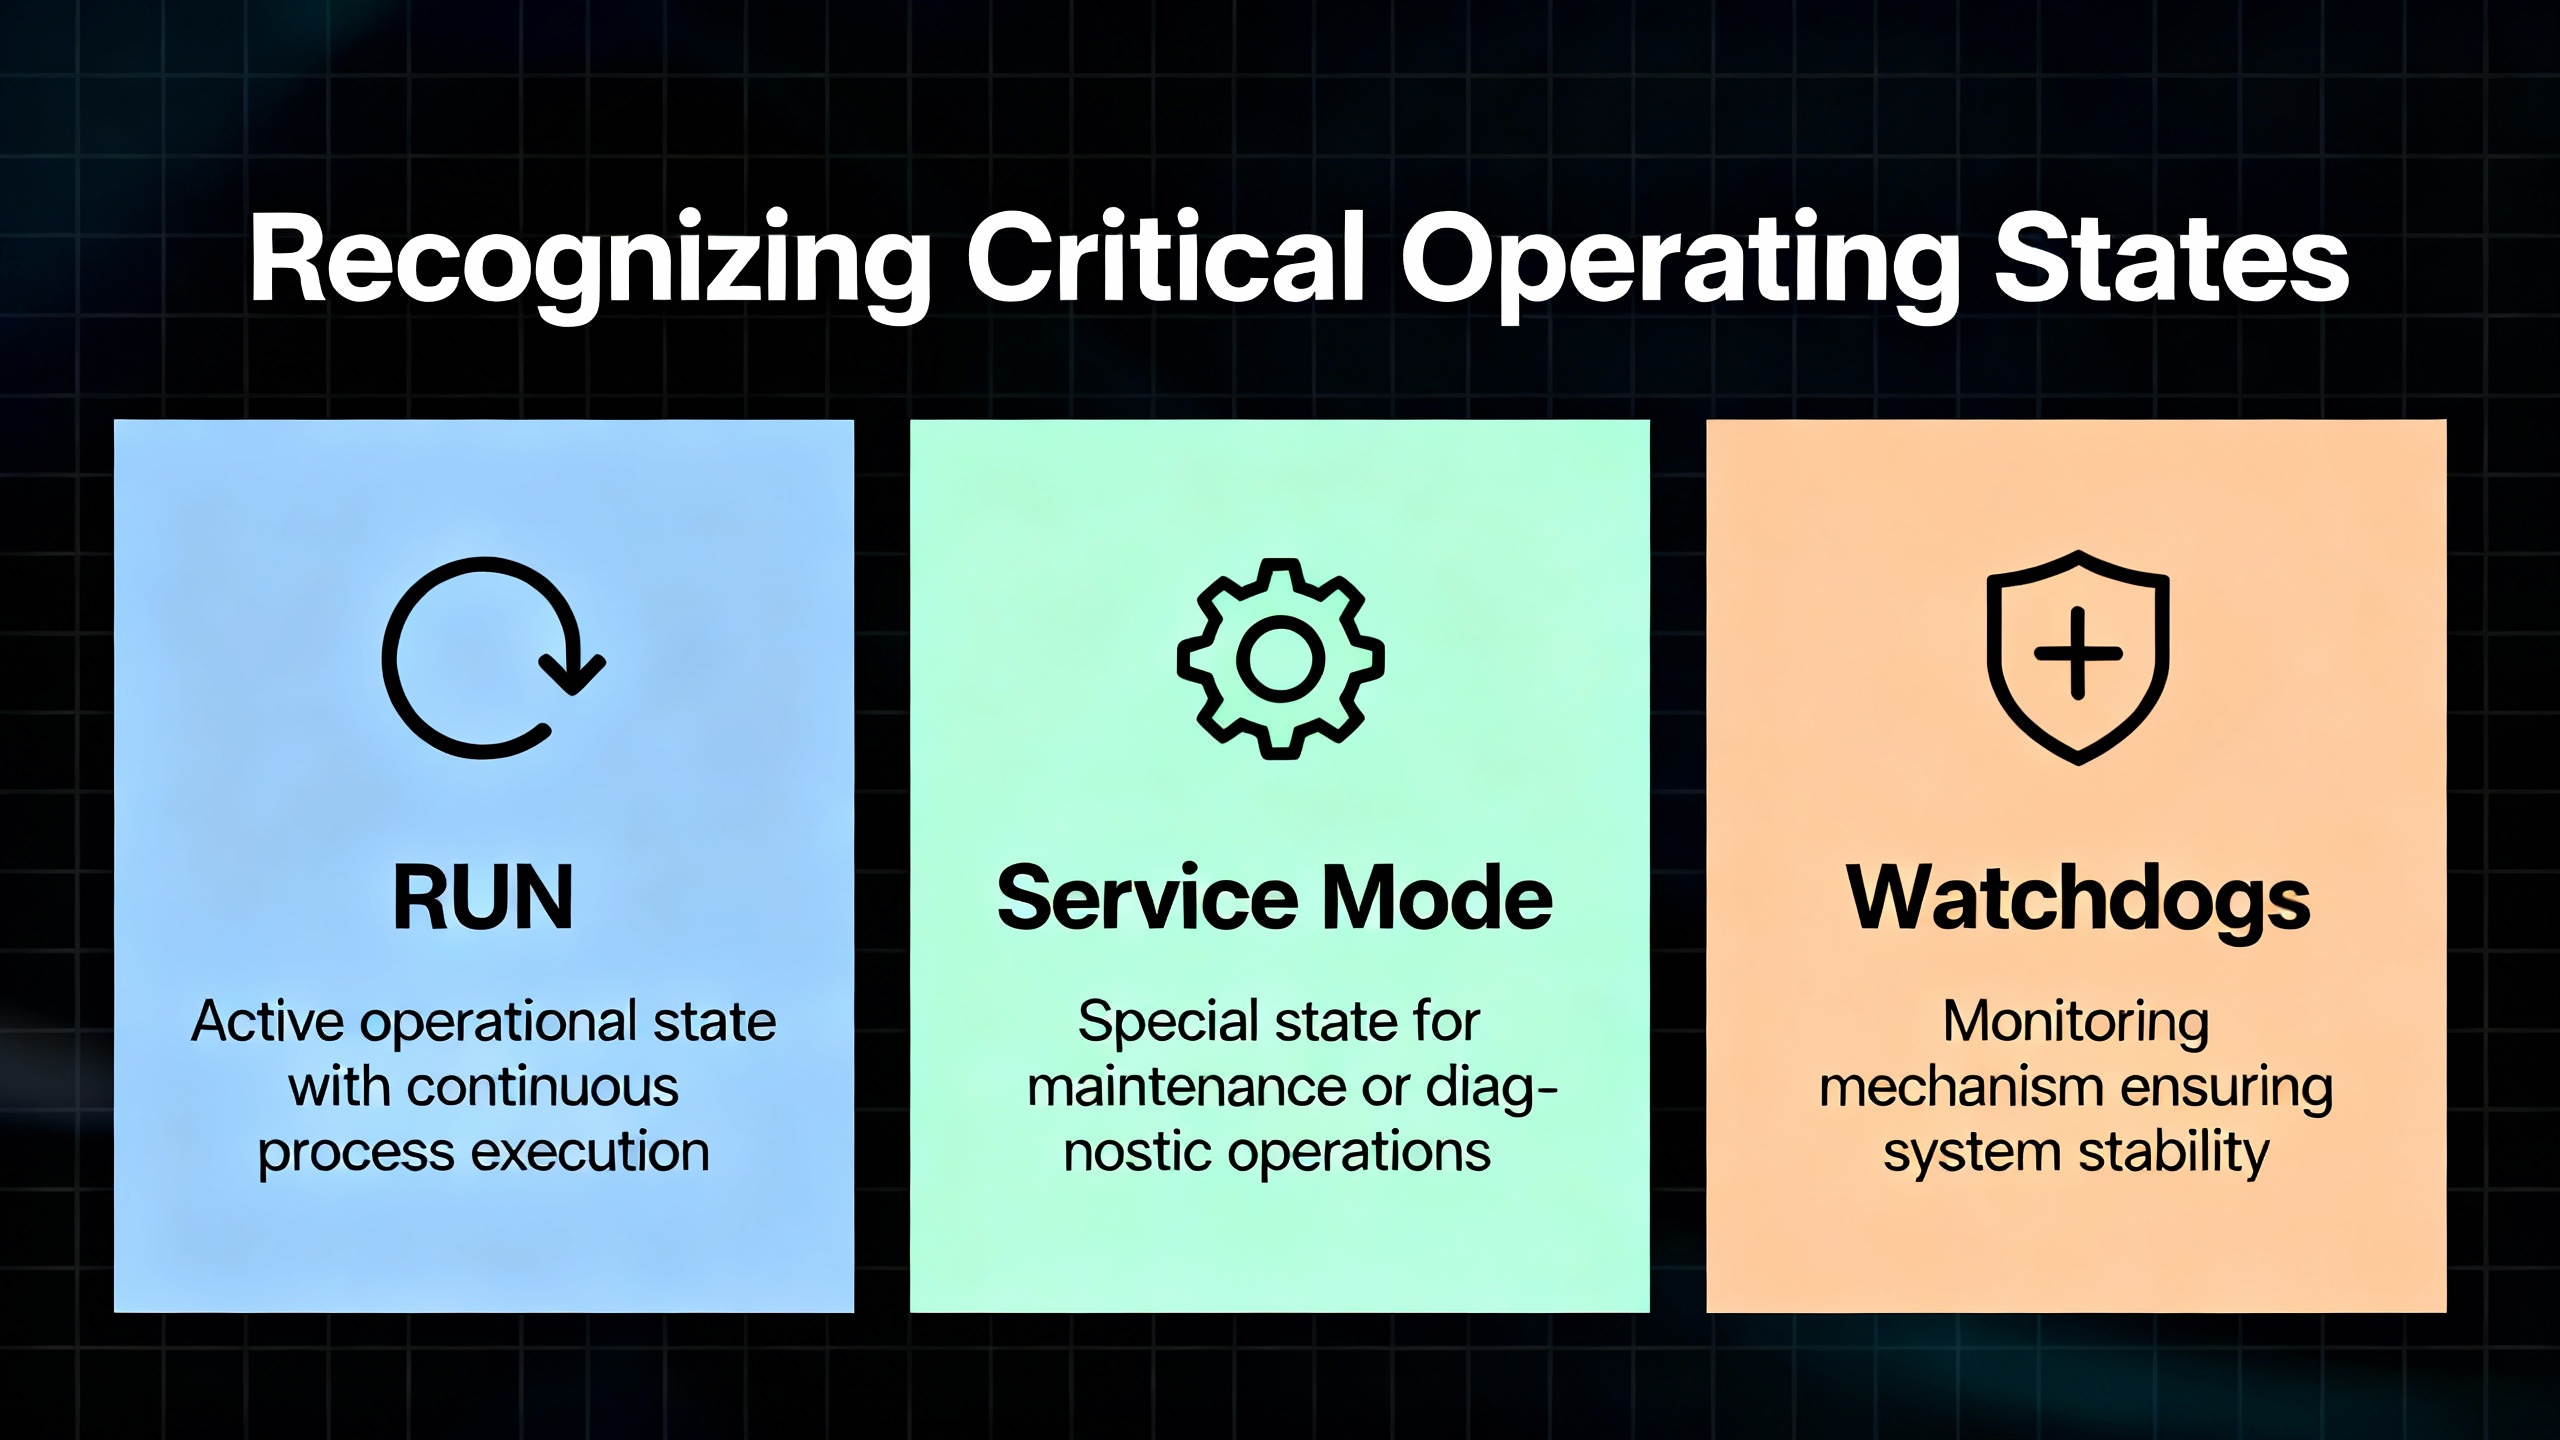
A B&R Community article on service mode defines it clearly: when a B&R PLC is in service mode, no task classes or application programs are running and the controller is fully halted. According to the same source, the controller enters service mode in three situations: someone presses the hardware Reset button, an engineer issues a ŌĆ£Stop TargetŌĆØ command from Automation Studio, or a critical runtime error occurs. In the last case, the fault is recorded in the PLC logbook and that log file becomes your primary evidence for rootŌĆæcause analysis.
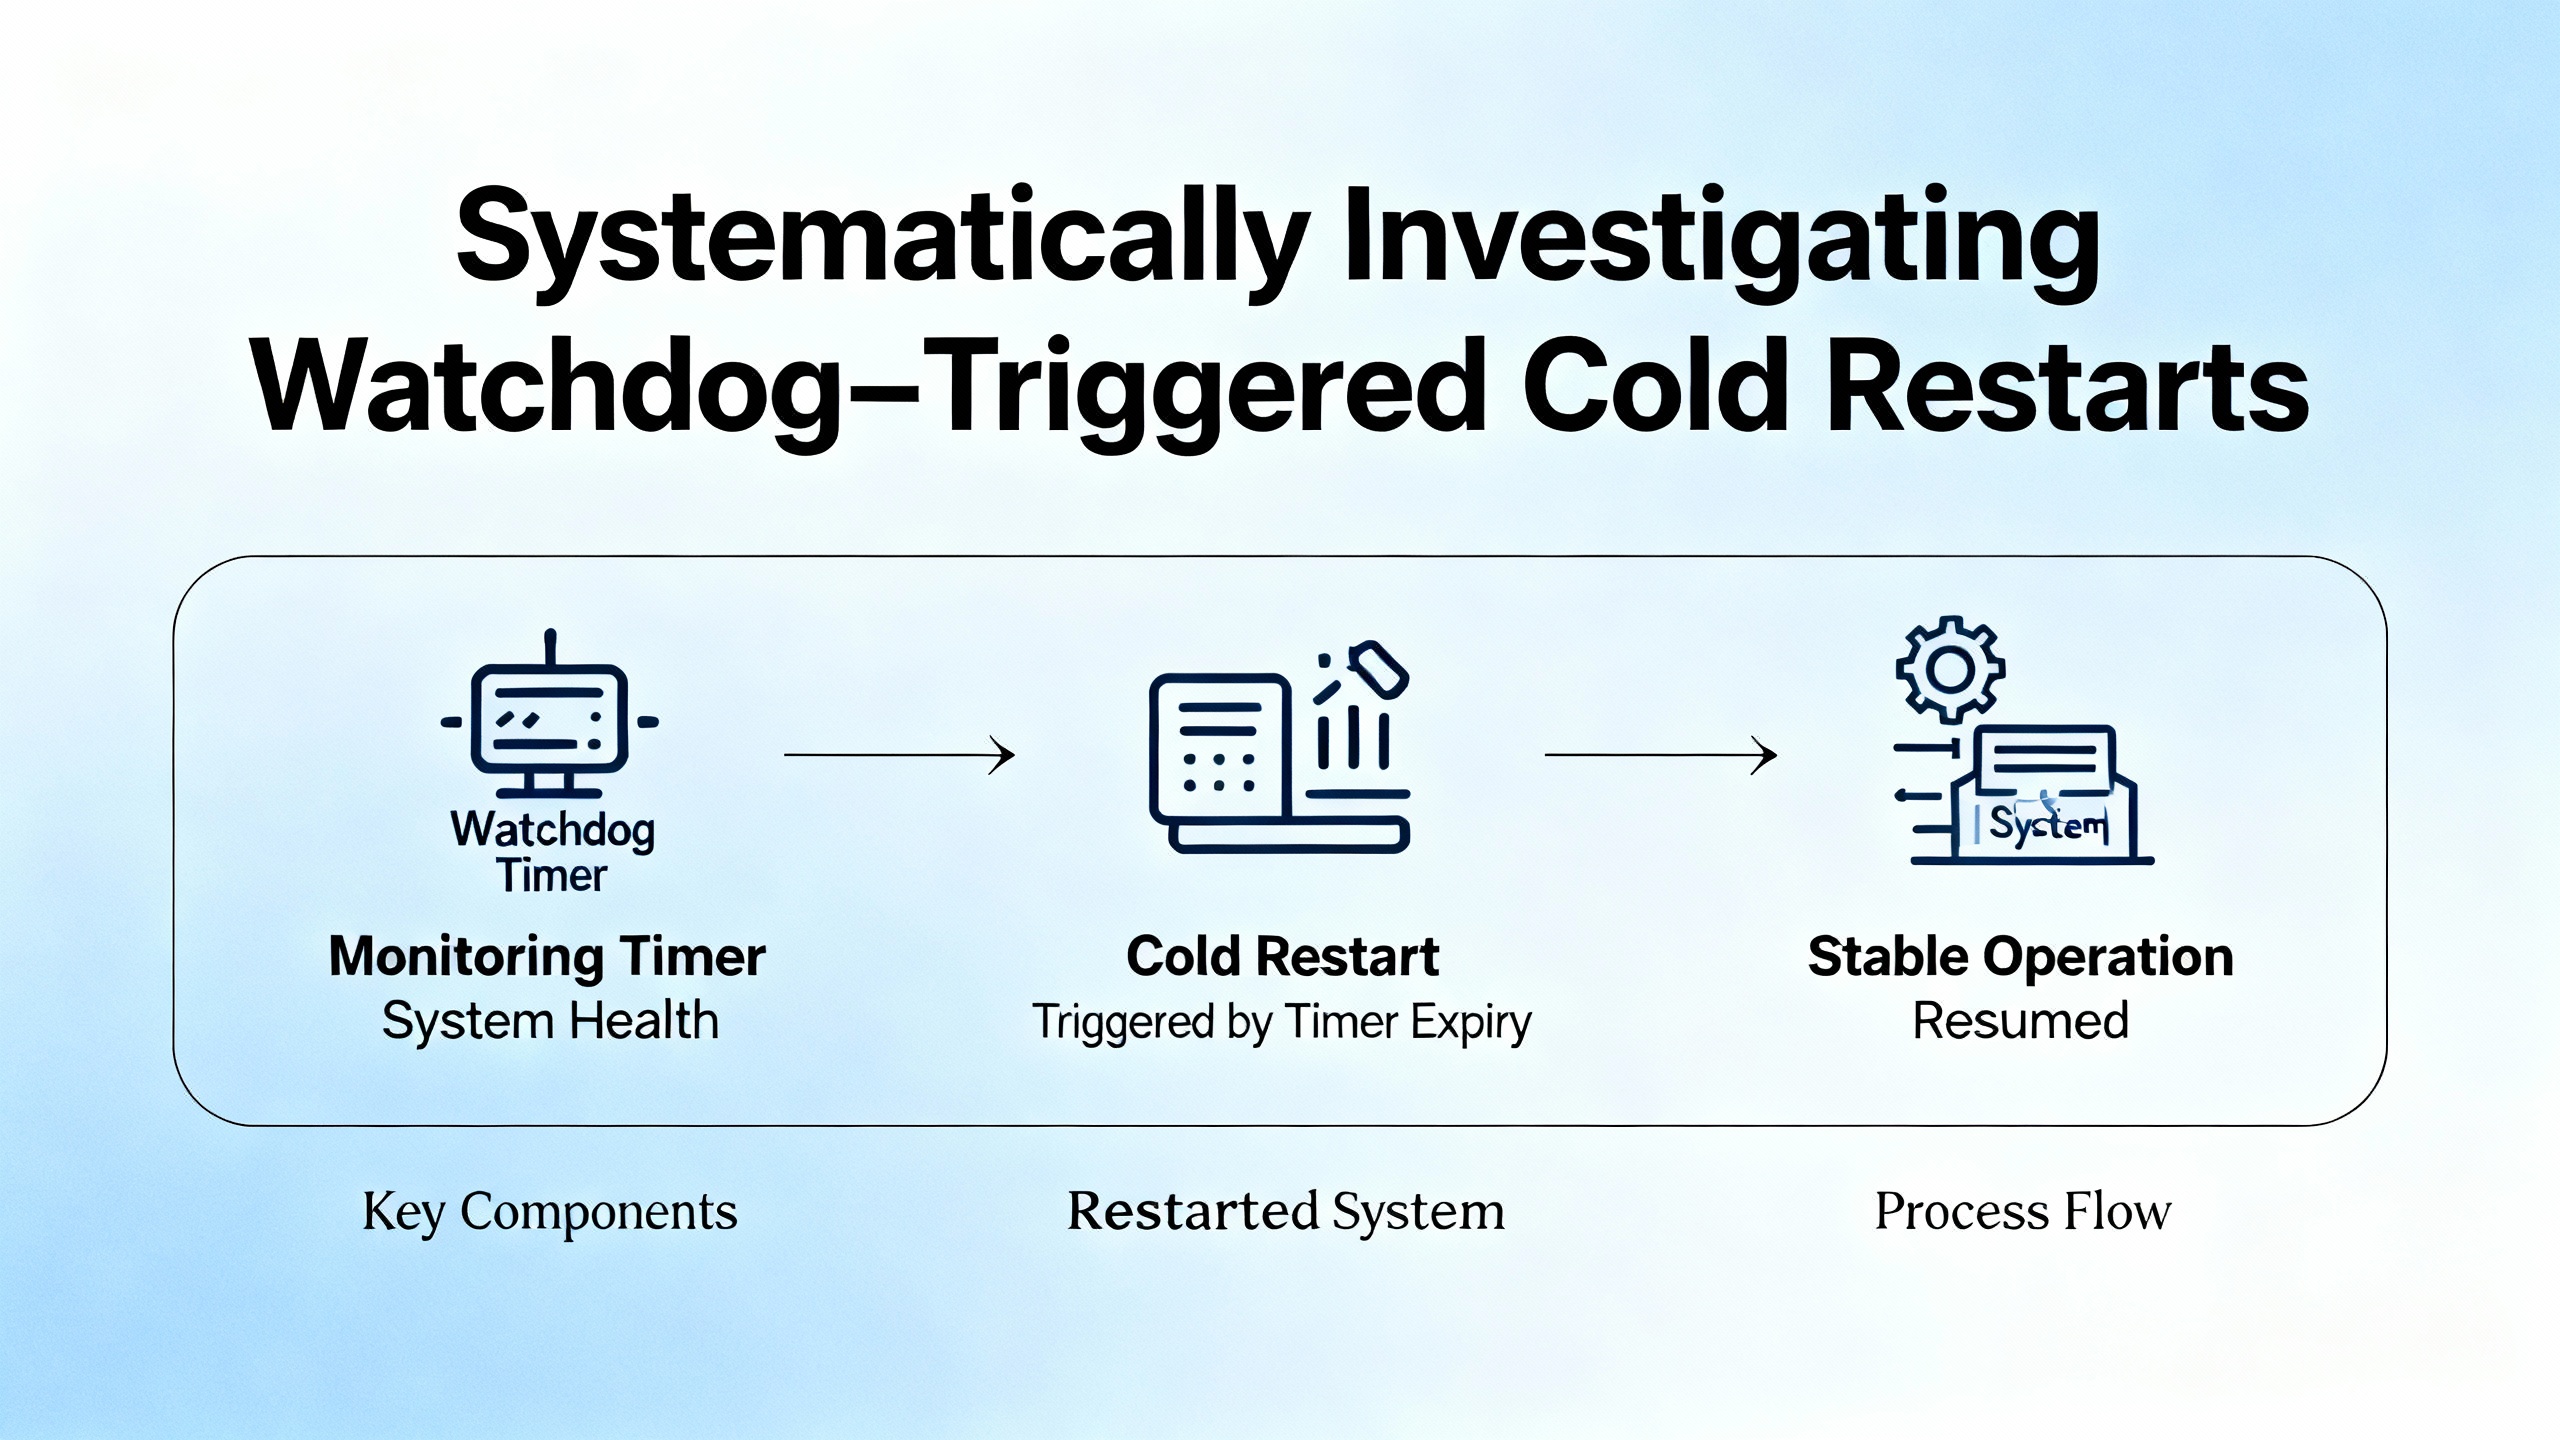
In another community case, a user running a CP3584 CPU with a stack of X20 modules saw recurring cold restarts. The PLC booted, the machine ran for several minutes, and then, roughly every five to ten minutes, the PLC restarted while the machine coasts through the reboot. The diagnostic log repeated a message along the lines of ŌĆ£Warning: Cold restart after watchdog or manual reset.ŌĆØ That phrase tells you that the runtime is not performing a warm restart; instead, something triggers a full cold restart, reset of memory areas, and reinitialization of the application.
In practice, watchdogŌĆætriggered cold restarts usually reflect one of two categories. Either the application or runtime is failing in a way that trips the watchdog, or the hardware and its power environment are unstable enough that the CPU cannot maintain deterministic operation. The user in the CP3584 case had eight years of stable operation, no recent software changes, and multiple communication and I/O modules. In that context it is reasonable, and consistent with B&RŌĆÖs own guidance, to suspect marginal hardware, power dips, or bus problems rather than suddenly defective application code.
The pragmatic response is always the same: do not guess. Capture hard evidence from the system, then work through potential causes logically.
When a B&R controller unexpectedly enters service mode, crashes, or restarts, the logbook and runtime files are your ground truth. B&RŌĆÖs documentation and community guidance describe three main ways to collect them without relying on Automation Studio.
For legacy systems, particularly those that were originally engineered around 2010 or earlier, B&RŌĆÖs Service Utility runs over an RS232 serial connection. It is officially supported on older Windows versions with the appropriate Visual C++ runtime. The workflow is straightforward: select the serial COM port, choose a function such as ŌĆ£Save Error Logbook,ŌĆØ and save the resulting file to disk for analysis or forwarding to B&R support.
On more modern SG4 controllers (IntelŌĆæbased PLCs) running Automation Runtime version 3.0 or higher, System Diagnostics Manager (SDM) provides an embedded web server accessible over Ethernet. Once a laptop is placed in the same IP subnet, SDM can be reached by its standard diagnostic path and offers a Logger view. For AR versions from about 3.08 and newer, SDM also exposes a System Dump function. By choosing System Dump with ŌĆ£Parameters + DataŌĆæFilesŌĆØ and uploading from the target, you obtain a compressed package containing log files and system data that support teams can analyze. For AR versions from 3.0 up to but not including 3.8, SDM is available but System Dump is not; in that case, the Logger tab and an ŌĆ£Upload from targetŌĆØ option allow you to extract the main system log file, often labeled arlogsys.
When the PLC runs ARembedded from a CompactFlash or CFast card and physical access is easier than network access, the CF/CFast approach is often the most robust. Using a card reader plus B&RŌĆÖs Runtime Utility Center, you can back up files from the CF or image file. In practice this often means navigating to the data partition, finding the appropriate runtime system directory, and copying all entries whose names start with a special character that denotes log files. Those files, once copied to a PC folder, give you offline access to error history and system behavior.
The recommended practice, reflected in B&RŌĆÖs own guidance, is simple. Choose the diagnostics collection path that matches the age and connectivity of the controller, extract the log or system dump, and either analyze it yourself if you are deeply familiar with Automation Runtime or forward it to B&R support with a precise description of the observable symptoms on the machine.
Returning to the CP3584 cold restart example, the missing piece in the forum thread was a systematic diagnostic plan. The log message alone tells you a watchdog or manual reset is involved; the question is how to narrow down whether the root cause is power quality, a dying module, a bus issue, or something in the application.
A separate B&R Community article on ŌĆ£helpful I/O datapoints for machine diagnosticsŌĆØ gives exactly the toolbox you need. Modern B&R I/O modules expose diagnostic variables that can be mapped into the application. These datapoints provide a continuous, machineŌĆæreadable health picture for each module, power supply, and bus.
At the module level, datapoints such as ModuleOk, SerialNumber, and ModuleID are available in the I/O mapping. ModuleOk is a boolean that indicates whether the module is operating correctly. SerialNumber and ModuleID uniquely identify the hardware, which is useful both for HMI display and for logging. Interestingly, Automation RuntimeŌĆÖs hardware watchdog can be configured to supervise modules and reboot the controller into service mode if a module is missing. The community recommendation, however, is to disable this supervision per module and instead monitor ModuleOk from your application. That way you can trigger alarms and controlled reactions yourself while preserving the ability to run a partial machine for testing when some hardware is not installed.
The power supply is another key suspect in unexplained restarts. For example, the X20PS2100 power supply module exposes two status inputs. StatusInput01 goes true when the bus supply drops below roughly 4.7 V, and StatusInput02 goes true when the I/O supply falls below about 20.4 V. Additional datapoints SupplyVoltage and SupplyCurrent, when enabled through configuration, provide exact voltage and current values. Mapping and logging these values gives you a way to correlate cold restarts or service mode entries with genuine brownouts or current spikes instead of speculating.
Digital outputs add further visibility. Each channel usually offers a StatusDigitalOutput flag that becomes true when an output is commanded on but the module detects a wiring or load problem. The recommended behavior in that situation is to switch the output off and raise an alarm to the operator. If your machine is experiencing intermittent load faults that stress the power rails or modules, those output status flags can tie events together.
Analog input modules typically provide a StatusInput value, often as an unsigned integer where individual bits represent diagnostic states such as invalid measurements or open circuits. The exact bit definitions depend on the module, so the community advice is to refer to the module documentation and decode the bit field correctly. Keeping a decoded view of StatusInput in your HMI or diagnostic pages removes a lot of ambiguity when analog sensors misbehave.
On top of all this, fieldbus health is critical. The Powerlink master contributes datapoints such as CycleOk, which indicates that cyclic communication is running, and SyncOk, which shows that time synchronization is healthy. Counters like FailedCycleCount number failed Powerlink cycles, while CycleIdleTime shows the unused portion of the cycle. The recommendation from practice is to keep CycleIdleTime above roughly 15 percent of total cycle time to avoid overloading the bus. Other counters such as SyncErrorCount, AsyncErrorCount, and ModuleLostWhileOperational are particularly valuable. They do not indicate one catastrophic failure; rather, they reveal trends and intermittent problems, especially issues that only occur when certain motors or devices are active.
The X2X bus has similar diagnostics. The X2X master exposes SyncErrorCount, AsyncErrorCount, and ModuleLostWhileOperational. When a remote X2X module stops communicating, ModuleLostWhileOperational increments and correlates strongly with the affected moduleŌĆÖs ModuleOk turning false. In a coldŌĆærestart scenario, a pattern of increasing bus error counters around the time of each watchdog event hints that bus timing or physical layer problems may be involved.
By mapping all of these datapoints to internal variables and integrating them with an alarm system such as MpAlarmX, or by writing them into a logging mechanism like the Automation Runtime Logger via ArEventLog or the userŌĆæmaintained UserLog library, you make sure that diagnostic entries appear alongside other system messages and are preserved in system dumps. That is the difference between ŌĆ£the PLC just restartedŌĆØ and ŌĆ£every time the conveyor runs at speed, the Powerlink FailedCycleCount spikes and ModuleLostWhileOperational increments on the remote drive node shortly before a watchdog reset.ŌĆØ
A separate B&R Community discussion about the X20 BC0083 module on a Powerlink bus illustrates how to apply bus diagnostics in a concrete case. While the excerpt does not include the original symptoms, a responder suggested that the core issue was likely related to timing problems or collisions on the Powerlink network. The practical recommendation was to enable monitor mode on the relevant components and read out the diagnostic datapoints on both the Powerlink interface card and the X20 BC0083 module.
Another community member suggested a very simple but important hardware step: replace the Powerlink cable. That is consistent with realŌĆæworld experience. Physical layer issues such as damaged cables, poor connectors, or electrically noisy routing are common causes of intermittent bus failures. The thread did not record a final confirmed solution, but it did reinforce a pattern. When facing suspected bus issues, start with the diagnostics that already exist in the bus master and modules, turn on monitor modes, watch health counters over time, and then apply straightforward hardware checks like swapping cables before diving into firmware or application rewrites.
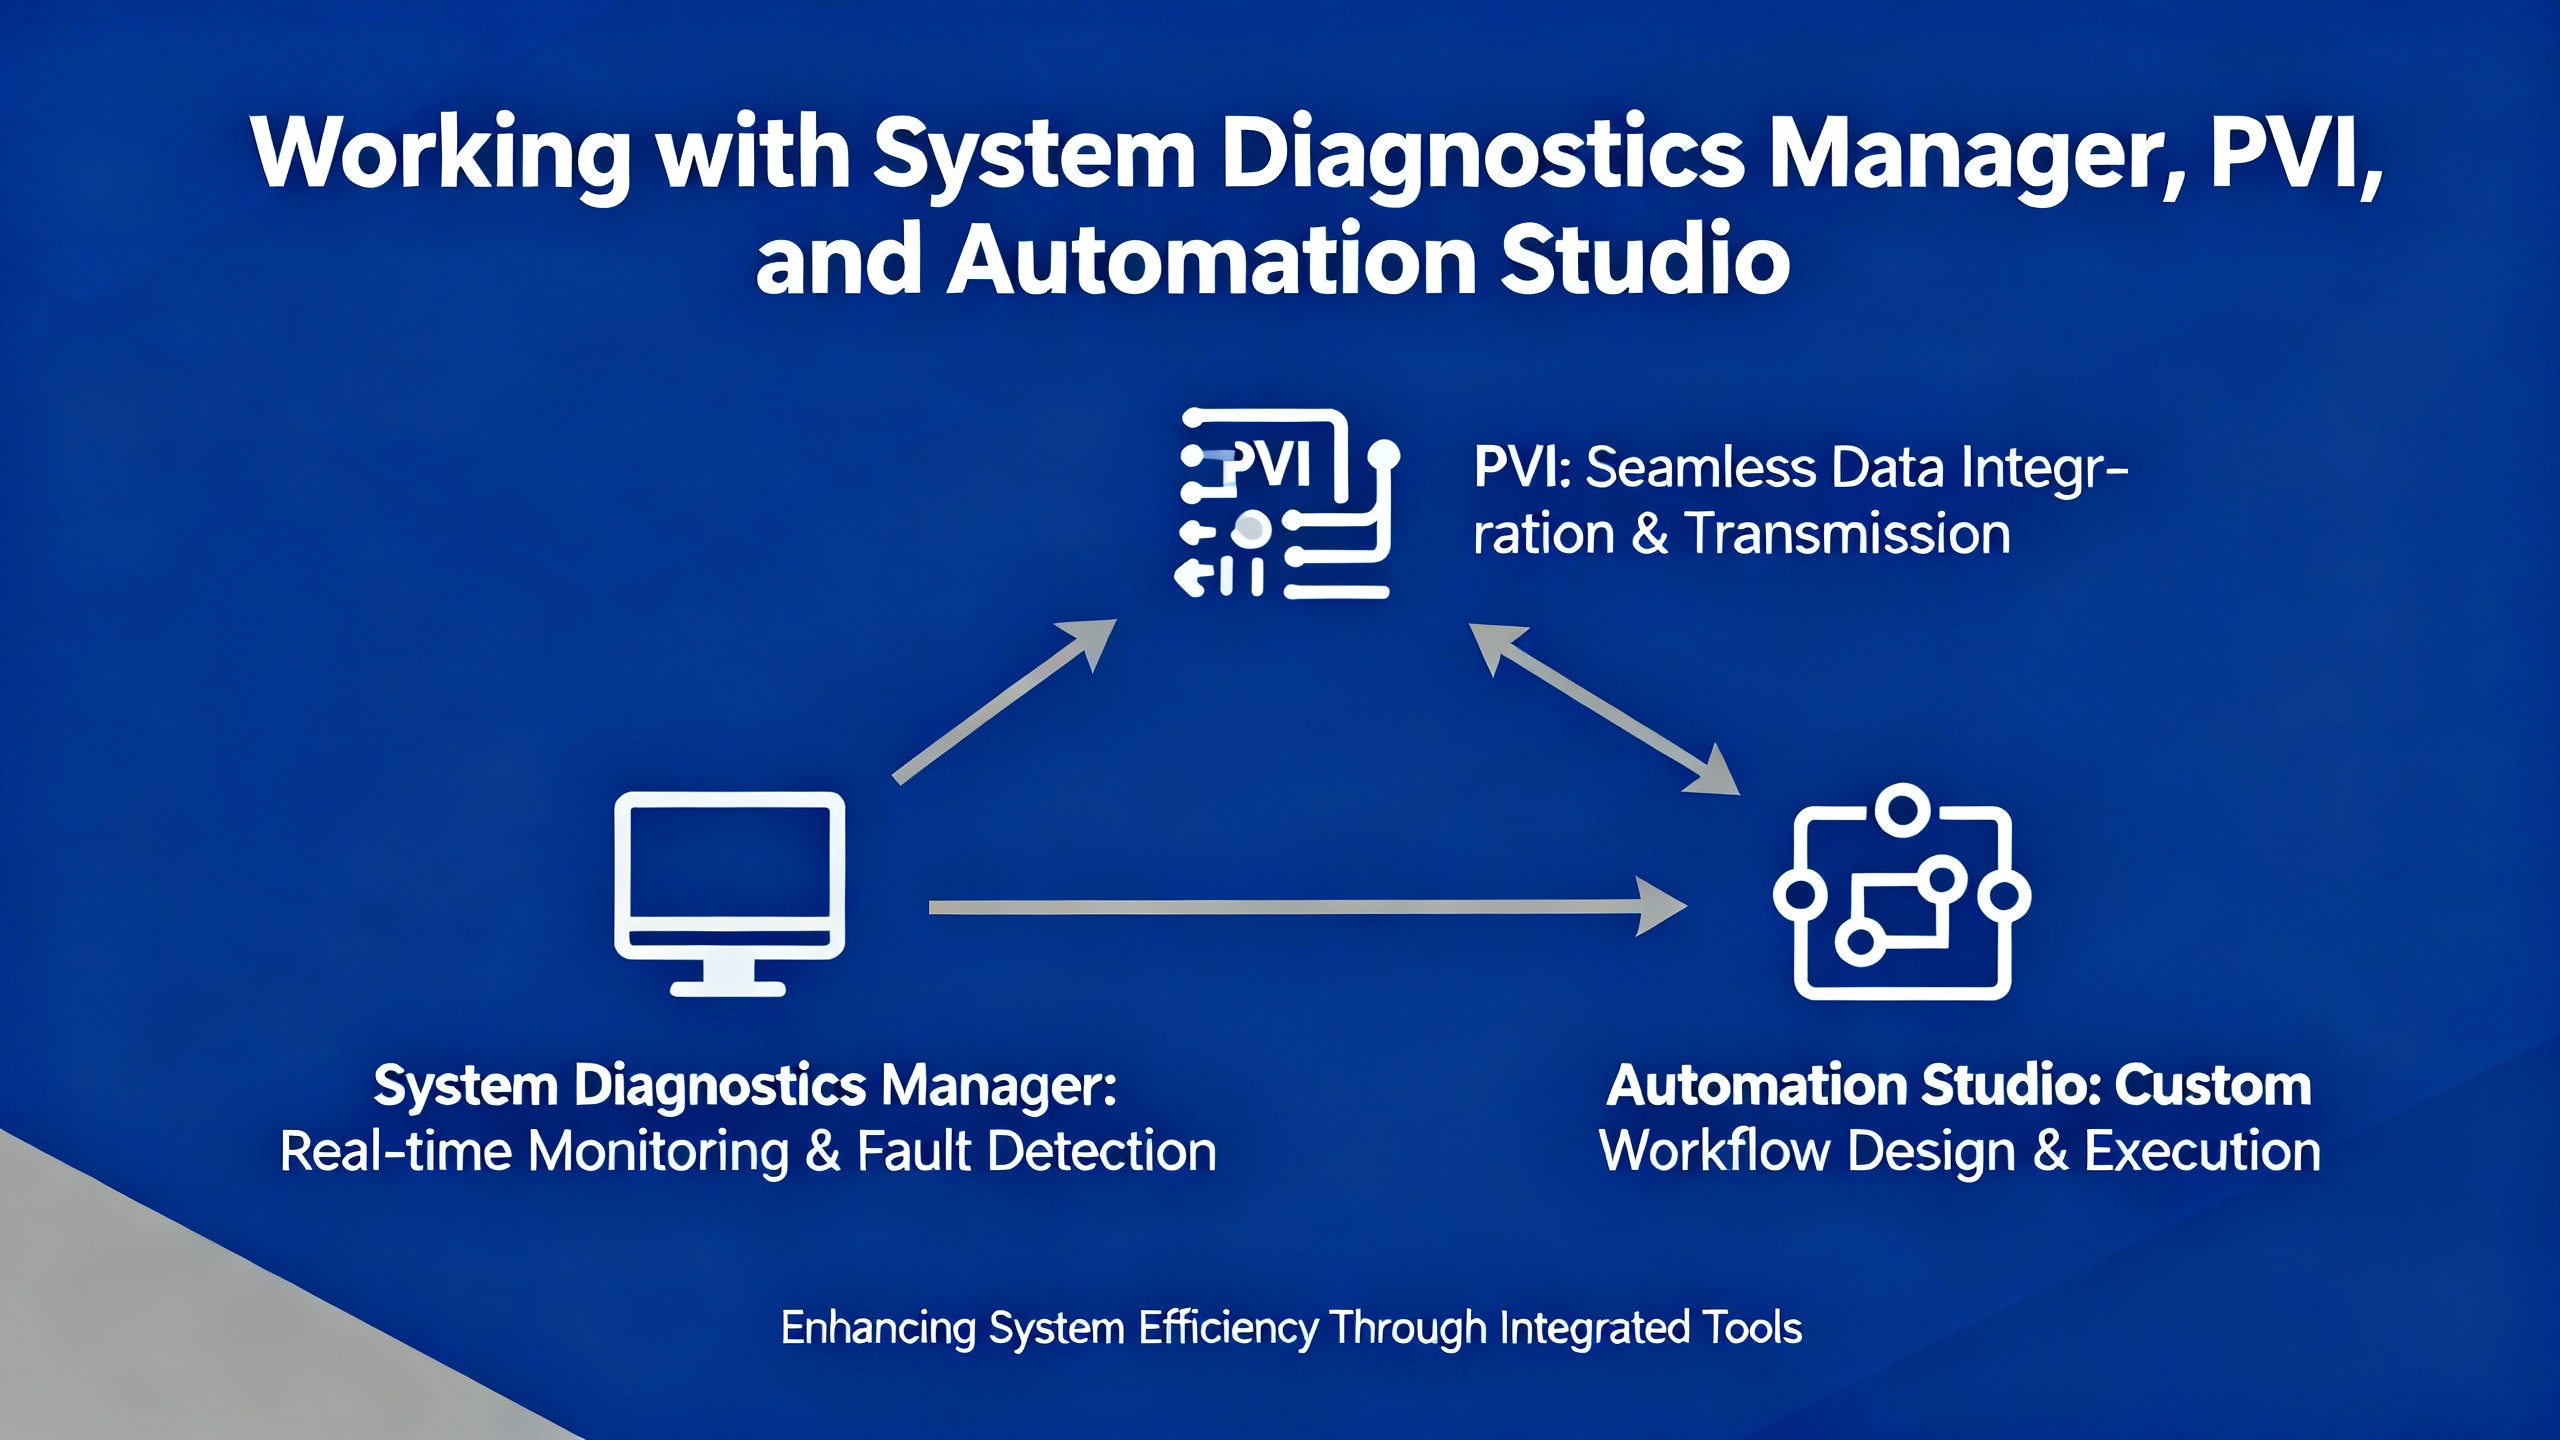
Diagnostics are not only about the PLC and I/O; the engineering PC and software stack matter too. B&RŌĆÖs tooling architecture centers on Automation Studio and the PVI (Process Visualization Interface) communication stack, with SDM providing a controllerŌĆæside web interface.
For controllers running Automation Runtime version 3.0 or later on SG4 hardware, SDM serves as a builtŌĆæin web server that exposes diagnostics over Ethernet. It allows you to read logs, check module states, and, in more recent versions, generate full system dumps. In practice, SDM often becomes the fastest way to get basic health information and error logs when you do not have Automation Studio installed on your laptop.
At the same time, you should treat SDM as part of your plantŌĆÖs critical infrastructure from a security standpoint. A CISA industrial control systems advisory, ICSAŌĆæ23ŌĆæ068ŌĆæ02, describes a reflected crossŌĆæsite scripting vulnerability in SDM for certain Automation Runtime versions. In the affected versions, untrusted input could be reflected to a browser without proper sanitization, allowing an attacker to inject JavaScript into a userŌĆÖs SDM session. The advisory notes that the vulnerability is remotely exploitable, has low attack complexity, and that public proofŌĆæofŌĆæconcept exploits exist.
The vendor recommendation summarized in that advisory is to upgrade SDM to the latest available runtime version where possible and to follow network security best practices. That includes avoiding direct Internet exposure of control systems, placing PLCs and SDM behind firewalls separated from business IT networks, and using secure remote access methods such as VPNs while keeping those tools updated. It is a good reminder that diagnostics services, because they expose rich system information, should be patched and protected just like any other critical component.
Sometimes the problem is not with the PLC at all but with the engineering environment. One B&R Community thread describes a situation where SDM diagnostics worked fine, but within Automation Studio 4.12 the ŌĆ£Online ŌåÆ Settings ŌåÆ Browsing for targetsŌĆØ dialog did not show any driver or PLC, even though the exact same setup worked on a clean test system.
The community analysis pointed away from a general product defect and toward a damaged or incomplete PVI installation, or interference from security tools such as antivirus or strict codeŌĆæexecution policies. The recommended path was to reinstall PVI using the current development setup and default options, explicitly leaving the ŌĆ£Install PVI Manager as serviceŌĆØ option unchecked so that PVI Manager runs as a normal process rather than a Windows service. During installation, the advice was to watch closely for error messages that might reveal underlying permission or OS issues.
After reinstalling, the guidance was to close all windows inside Automation Studio, particularly any online settings dialog that might trigger automatic PLC searches on project reopen, then restart Automation Studio. With the PVI Monitor visible, the next step was to trigger ŌĆ£search for PLCŌĆØ and observe whether the PVI Manager process stopped or behaved abnormally. If the search worked and PVI Manager remained running, the issue was effectively resolved.
If problems persisted, deeper diagnostics included checking for an npcap folder under the Windows programs directory and identifying the version of the packet capture driver file, as well as verifying the version of an SNMP related library in the PVI installation folder. The goal was to detect mismatched or corrupted components that could affect network scanning and PLC discovery. Reviewing antivirus and security logs for blocked installers or executables was also recommended.
From a field perspective, this case reinforces an important point. When Automation Studio cannot see a PLC that SDM can reach, suspect local PC environment issues first: corrupted PVI components, overŌĆæzealous security software, or inconsistent network capture drivers.
The relationship between Automation Studio and the PLCŌĆÖs IP address can also create confusing behavior during an initial transfer. A Stack Overflow question about an X20CP1684 controller described a pattern where the first initial transfer put the PLC into boot mode, wiped the configured IP address, and left Automation Studio waiting indefinitely for reconnection.
The key detail, which aligns with B&RŌĆÖs design, is that during an initial transfer the controllerŌĆÖs settings, including IP configuration, are reloaded from the Automation Studio project. If the IP address in the project differs from the IP currently used to connect to the PLC, the connection will be lost midŌĆætransfer because the PLC adopts the new project IP.
The community advice from that case was to ensure that the IP address configured in the Automation Studio project is identical to the IP address used to reach the PLC before starting the initial transfer. The question author noted that, for their very first transfer, enabling Simulation mode in Automation Studio allowed the transfer to complete and the PLC to enter run mode. More generally, the recommended pattern is to set the PLCŌĆÖs IP address via the most reliable available method, then configure the same IP settings in the project, and only then perform the initial transfer. On the PC side, using a fixed IP on the engineering laptop in the same subnet as the PLC avoids network instability during this critical operation.
Diagnostics on older B&R platforms have their own quirks. In a B&R Community thread about a System 2003 PLC, an engineer faced a controller that no longer communicated with a subsupplierŌĆÖs HMI PC. LED states showed error and ready indicators on, with mode off, which the user interpreted as a faulted ŌĆ£service mode.ŌĆØ The rack included an Ethernet communication module, leading to the question of whether online diagnostics and program download could be performed over Ethernet instead of the traditional serial connection.
Complicating matters, the engineer had Automation Studio available only on a laptop without a serial port. They had heard that these controllers rely on batteryŌĆæbacked memory and suspected that the application program might have been lost. A backup copy of the original program likely existed, but they lacked a clear, documented path to get online, diagnose the fault state from the LED combination, and restore the application.
This type of situation underscores the value of maintaining both legacy tools and clear documentation. For older controllers like System 2003, RS232 access and tools such as B&R Service Utility may still be necessary, even if there is an Ethernet module in the rack. Having a validated backup of the application, along with notes about how to reestablish communications in case of memory loss, can be the difference between a quick recovery and a prolonged outage when the OEM is unavailable.
Once you are collecting logs and mapping diagnostic datapoints, the next step is to make error messages more informative. A B&R Community discussion on troubleshooting page faults highlights one useful option: the AdvIecChecks library mentioned in that thread. Participants described it as a compact library that adds ŌĆ£a lot of very useful informationŌĆØ to error messages, particularly in the context of page faults and similar runtime errors. Although the detailed implementation is not shown, the fact that experienced users requested and adopted it indicates its practical value.
In parallel, integrating diagnostic datapoints with structured alarm and logging frameworks pays longŌĆæterm dividends. The ŌĆ£helpful I/O datapointsŌĆØ discussion explicitly recommends tying these variables into alarm frameworks such as MpAlarmX and logging them through the Automation Runtime Logger with mechanisms such as ArEventLog or a dedicated user log library. When done consistently, diagnostic entries show up in the same log stream as application events and are included automatically in system dumps and CF backups.
From an onŌĆæsite troubleshooting standpoint, that means when a power supply voltage dips, a bus module drops off, or a moduleŌĆÖs ModuleOk flag goes false, those events appear as timestamped entries you can correlate with operator reports and production data, rather than as vague memories of ŌĆ£something flashed on the HMI a while ago.ŌĆØ
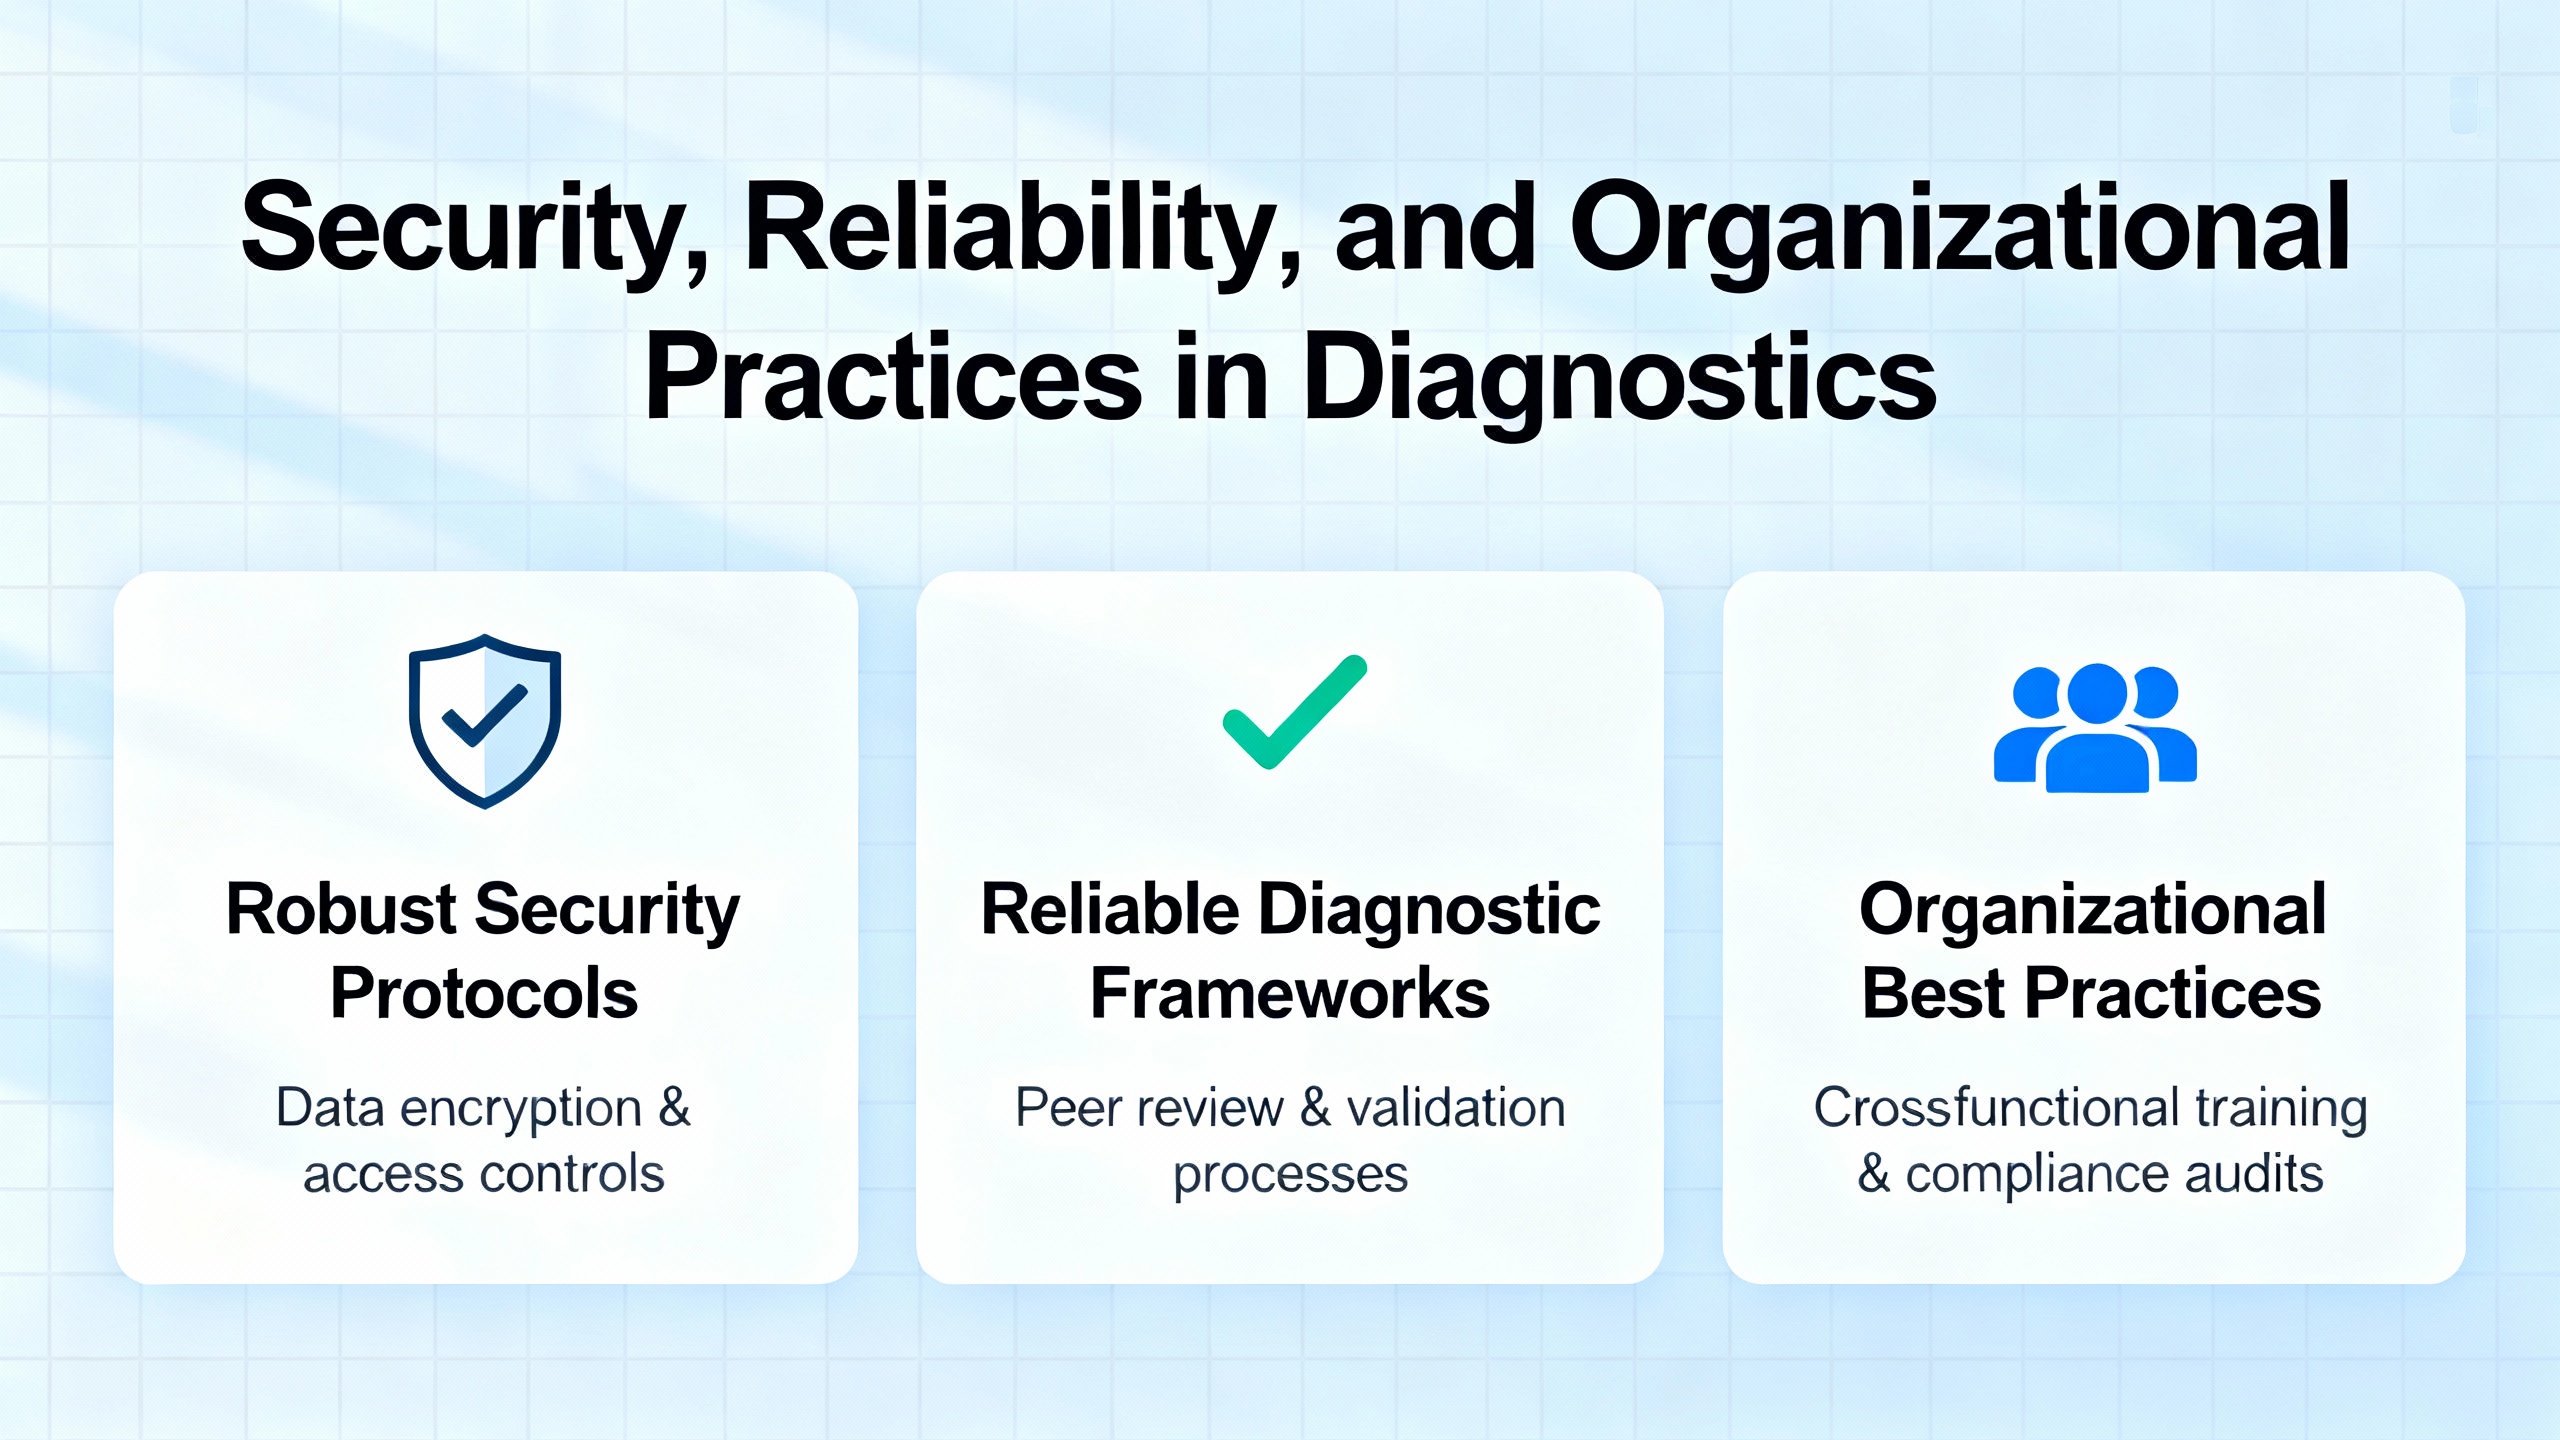
Modern diagnostics do not exist in a vacuum. They depend on robust infrastructure and sensible organizational practices. The SDM crossŌĆæsite scripting issue described in the CISA advisory is one example of why keeping controller firmware and diagnostic services up to date matters not just for functionality but also for cybersecurity.
CISAŌĆÖs recommendations for affected SDM versions emphasize wellŌĆæestablished industrial security practices. Control networks should not be directly reachable from the public Internet. PLCs, HMIs, and diagnostic tools should sit behind properly configured firewalls, separated from business information networks. Remote access, when needed, should use secure methods such as VPNs, with both the VPN solution and connected endpoints kept patched and monitored. Organizations should also monitor for suspicious activity and follow their internal incident response procedures, including reporting potential incidents to central authorities where appropriate.
On the reliability side, ensuring that engineering workstations are kept clean and that Automation Studio and PVI installations are maintained carefully is just as important. The PVI installation issues described in the B&R Community thread show how quietly corrupted components or restrictive security tools can block diagnostics, causing engineers to waste hours chasing ŌĆ£PLC communication problemsŌĆØ that are actually PC environment problems.
Finally, training matters. While access to a detailed B&R Academy course description on diagnostics and service was blocked behind a security page in the captured material, the existence of such courses is itself a signal. Investing in training that covers diagnostics, service procedures, and logging tools can dramatically shorten downtime when something goes wrong.
When a B&R PLC misbehaves in a production environment, the most effective approach is structured and repeatable. Start with what you can observe on the controller: LED states, whether the PLC is in RUN or service mode, and whether SDM is reachable. If the PLC is in service mode or has restarted unexpectedly, use SDM, B&R Service Utility, or CF/CFast access to extract logbooks or a system dump. That ensures you have a frozen snapshot of what the runtime recorded at the moment of failure.
Next, examine the I/O and bus level. Check module health via ModuleOk, identify specific modules by SerialNumber and ModuleID, and review power supply datapoints such as StatusInput01, StatusInput02, SupplyVoltage, and SupplyCurrent for signs of brownouts or overcurrent. For digital outputs, look at StatusDigitalOutput to reveal load or wiring problems, and for analog channels, decode StatusInput to distinguish between open circuits and other measurement issues.
Then turn to the fieldbuses. On Powerlink, confirm that CycleOk and SyncOk are healthy, monitor FailedCycleCount, and keep an eye on CycleIdleTime to ensure that cycles are not overloaded. Review SyncErrorCount, AsyncErrorCount, and ModuleLostWhileOperational on both Powerlink and X2X masters for patterns that correlate with machine operation. In cases like the X20 BC0083 thread, enable monitor mode and, if necessary, swap Powerlink cables and check physical routing to rule out simple but impactful cabling problems.
In parallel, verify the health of the engineering environment. Confirm that Automation Studio and PVI are installed cleanly and that security tools are not silently blocking PLC discovery. For initial project transfers, make sure the IP address in the project matches the controllerŌĆÖs configured IP to avoid losing connection midŌĆætransfer. If SDM or other tools reveal that the PLC and runtime are behaving, yet Automation Studio cannot see the target, focus on reinstalling PVI and checking components such as packet capture drivers and SNMP libraries as described in community guidance.
Throughout this process, make full use of B&RŌĆÖs diagnostic libraries and logging mechanisms. Map critical datapoints to alarms and log entries. Consider using enhanced libraries like AdvIecChecks where appropriate to enrich runtime error messages. When you have captured logs or system dumps, either perform a detailed analysis yourself if you are comfortable with Automation Runtime internals or share them with B&R support along with precise symptom descriptions and timestamps.
In the end, B&RŌĆÖs platform gives you the hooks you need to diagnose complex behavior, but it is the discipline of collecting structured evidence, using the right tools for the controller generation, and respecting both reliability and security that solves real problems on real machines. When you combine those elements, cold restarts, mysterious page faults, and elusive bus errors become manageable engineering problems instead of productionŌĆæstopping mysteries.


Copyright Notice © 2026 mooreautomated.com All rights reserved,Moore Automated is not an authorized distributor or representative of the manufacturers featured on this website. Brand names and trademarks featured are the property of their respective owners.
Leave Your Comment