

MP 3009X
Get A Quote
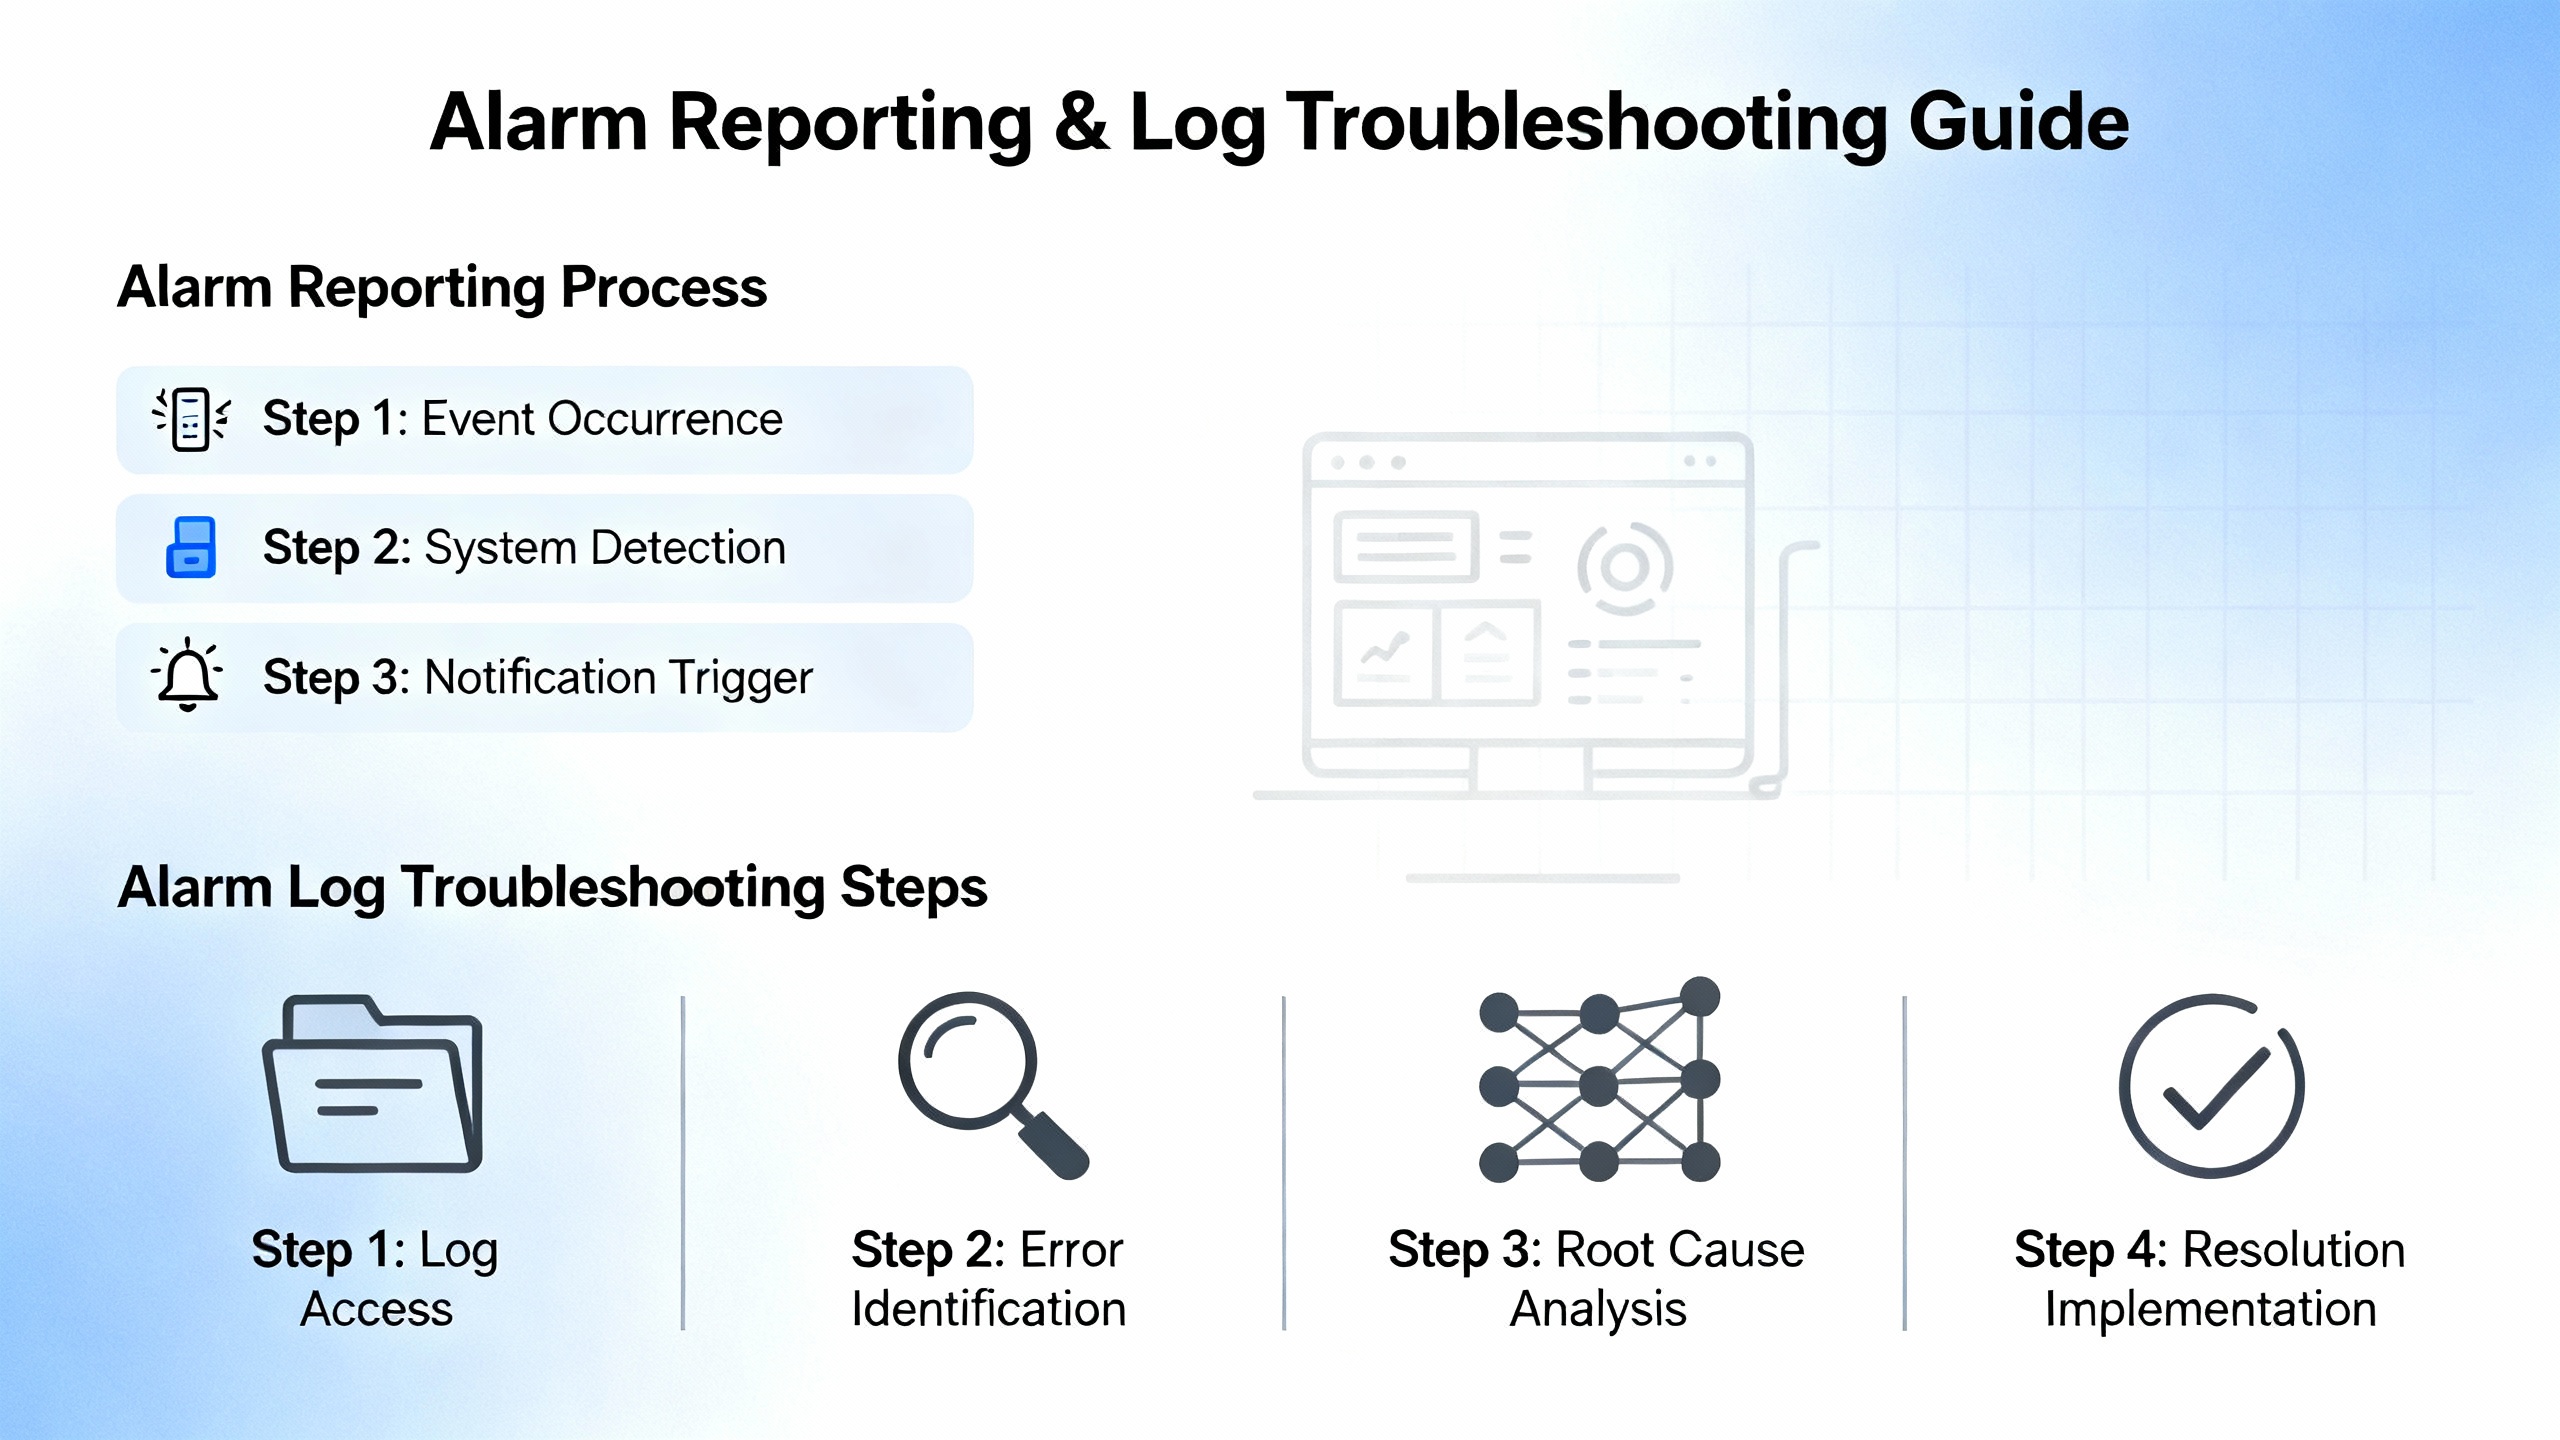
Industrial automation looks very different at 2:00 AM when a line is down, alarms are not behaving, and production is waiting. In that moment it does not matter how elegant your PLC code or HMI screens are; what matters is whether your WinCC alarm system tells operators clearly what is wrong, when it started, and what to do next.
This guide is written from the perspective of an onŌĆæsite engineer who lives with those alarms day in and day out. It draws on Siemens documentation and real support cases to walk through how SIMATIC WinCC (including WinCC Runtime Advanced, WinCC Unified and classic WinCC systems) handles alarms, where things commonly go wrong, and how to troubleshoot problems pragmatically without guesswork.
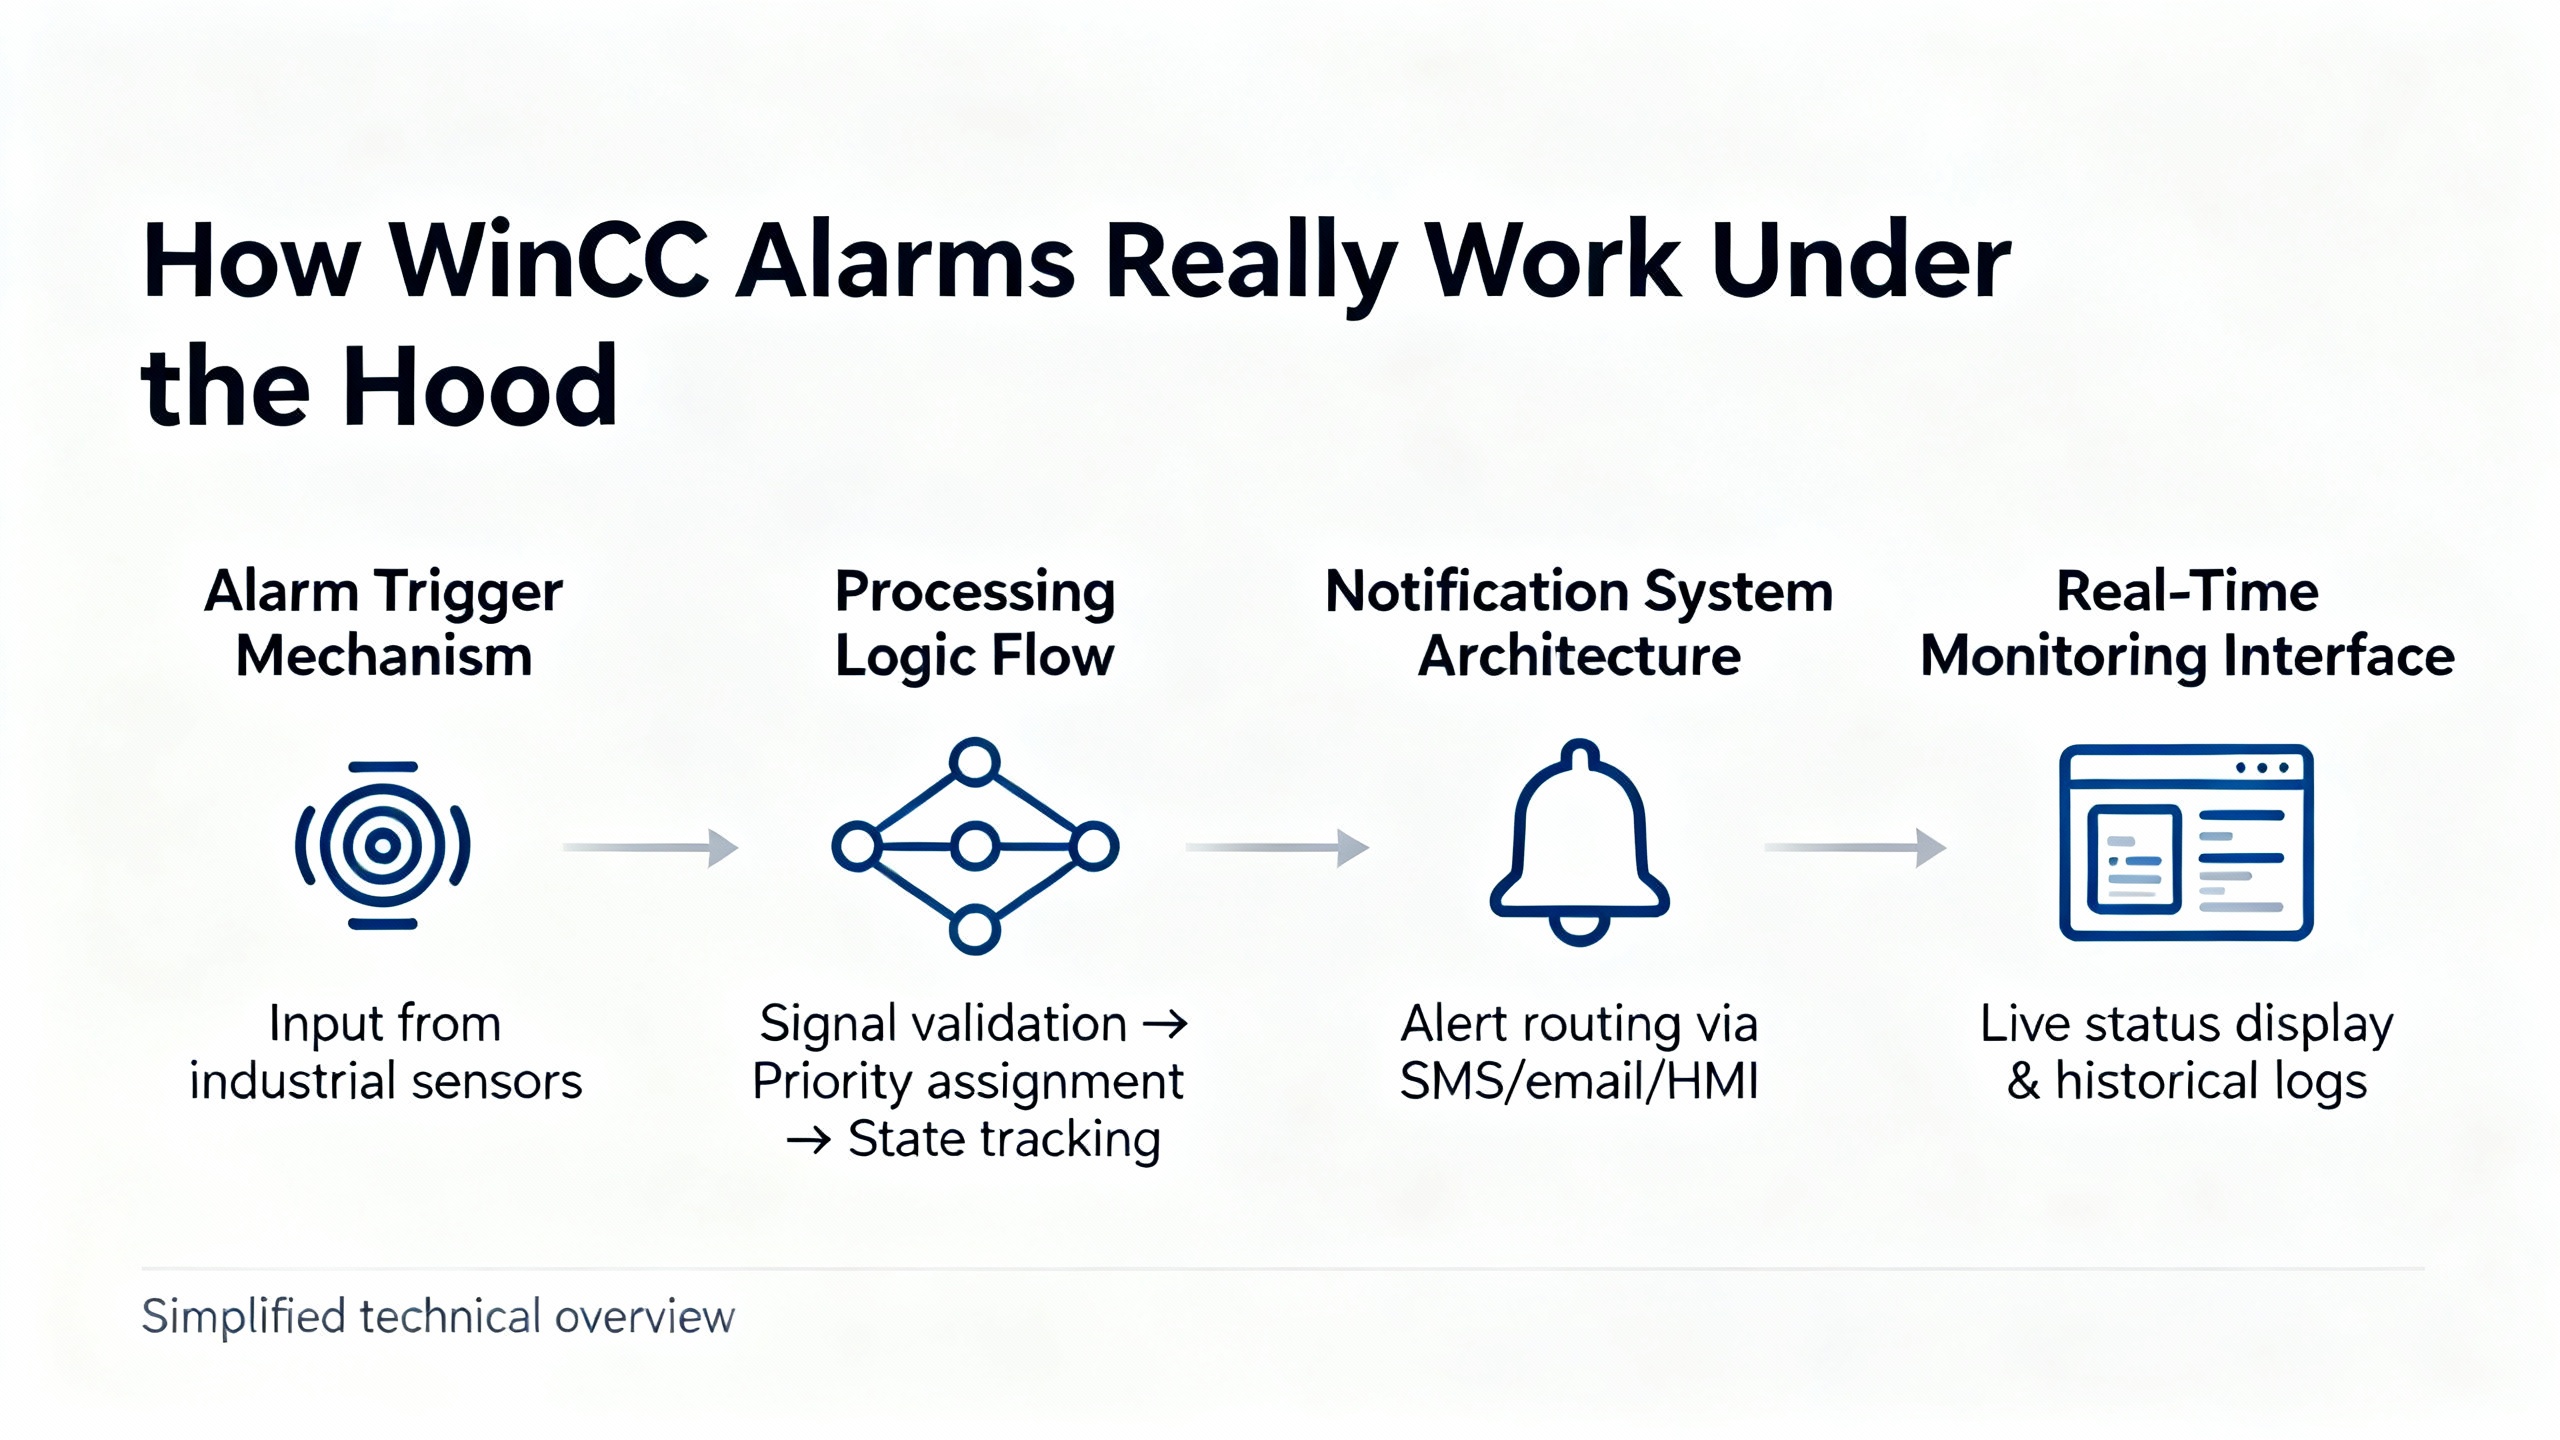
Before you can troubleshoot alarms, you need to understand what a WinCC alarm actually is from the systemŌĆÖs point of view. In Siemens documentation, an alarm is a structured object with several attributes that WinCC uses consistently across the engineering environment and at runtime.
Each alarm belongs to an alarm class. The class defines whether the alarm requires acknowledgment, how its state machine behaves, how it is displayed in runtime (for example, color and visual behavior), which logging targets it writes to, and its base priority. Classes are the backbone of consistent behavior. When similar alarms share a class, you get the same acknowledgment model and operator experience across the plant.
Every alarm also has an alarm number or ID. This number uniquely identifies the alarm on the device. The system assigns IDs, but you can reorganize them into sequential, meaningful ranges as long as each ID remains unique. System alarm IDs are reserved and have higher priority than user alarms, so you must not reuse those numbers; Siemens explicitly requires that user alarms be renumbered if they collide with system IDs.
Text is another critical attribute. The alarm text describes the cause and can contain dynamic output fields, such as a limit value or tag value. WinCC freezes the values of those fields at the moment the alarm state changes. This is extremely helpful in troubleshooting because the text carries the real process value at the instant the alarm went active or changed state, even if the process has moved on.
Every alarm is linked to a trigger tag. The alarm becomes active when the tag meets the configured condition, such as a bit changing state or an analog value crossing a configured limit. Analog alarms use limit values and are generated when the associated tag exceeds or falls below those limit thresholds, which enables conditions like maximum speed reached or pressure out of range to be monitored as alarms.
Behind the scenes, each alarm runs through a state machine governed by its class. States such as active, active and acknowledged, inactive and unacknowledged, and inactive and acknowledged define how the alarm behaves and what the operator sees. WinCC records timestamps for key state transitions, and alarm duration is defined as the elapsed time between the alarmŌĆÖs first trigger and its last status change, down to nanosecond resolution in the Unified system. This makes it possible to reconstruct event sequences and analyze how long conditions persisted.
In alarm displays, you decide which columns appear and which alarm attributes each column shows. Common configurations include columns for time, text, priority, current state, originating computer, user who acknowledged, and alarm duration. For web clients, WinCC can show the IP address in the Computer column so you know where an acknowledgment came from. These design choices matter: the columns you expose are the operatorŌĆÖs primary troubleshooting tool during a fault.
One of the most stressful issues is when operators insist that ŌĆ£the alarm is not coming in,ŌĆØ while you know the PLC and HMI are talking. Siemens Industry Online Support documents a pattern where process pictures work, server data loads correctly on clients, and communication is healthy, but messages do not show in the Alarm Control at runtime. The cure is usually in configuration rather than in the PLC.
Here are typical runtime symptoms and the technical factors behind them.
| Symptom at runtime | Likely technical cause | Where to focus first |
|---|---|---|
| No alarms appear although process pictures and tags are updating | Filters in the alarm control or wrong server selection | Alarm Control selection dialog and server selection |
| Only recent alarms appear; older ones seem to be ŌĆ£missingŌĆØ | Display limit of 1,000 messages in Alarm Control | Archive configuration and expectations for history |
| Some specific alarms never show up, even when tags change | Multiple alarms assigned to the same message bit, or misconfigured analog alarm tags | Alarm Logging configuration and bit assignments |
| Only chronological OS messages are missing, others work | Incomplete OS compilation or download | Recompile and reload AS and OS |
WinCC Alarm Control limits the number of messages it displays for performance reasons. By default, only the 1,000 most recent alarms are visible in the control, even though the archive may store many more. When operators scroll back and complain that ŌĆ£older alarms are gone,ŌĆØ it is often just the display window, not the archive, that is limited.
A more common practical issue is filtering. Siemens documentation explicitly calls out active filters in Alarm Control as a frequent cause of missing alarms. The Runtime selection dialog lets operators or engineers filter by class, time, server, and other attributes. If a filter remains active, new alarms may never match the criteria and therefore never appear.
On site, I routinely walk to the HMI and open the alarm selection dialog in runtime. The first action is to use the function that deletes the entire selection, then confirm with OK, effectively clearing all filters. If alarms immediately appear, the problem was purely filtering. If the button to open the selection dialog is not visible, it must be enabled in the Alarm Control properties under the toolbar configuration in engineering. Also pay attention to persistence options: some configurations will reapply filter settings when the picture is reopened, which can make the problem recur after picture changes.
In multiŌĆæserver or clientŌĆōserver projects, Alarm Control must know which serverŌĆÖs alarms to display. In its properties, you can choose ŌĆ£All serversŌĆØ or a specific list. If the wrong server is selected, or if no server is selected at all, the control may appear empty even though alarms are being generated on another node.
On WinCC clients, Siemens emphasizes the need to configure a standard server. If a client has no standard server, it cannot generate its own operating messages and might not handle alarms correctly. When troubleshooting away from the engineering station, I always check the OS project configuration for server assignments and confirm that the client has a valid standard server configured.
Another area where alarms silently disappear is in the bit assignments. For bit-message procedures, every message variable and message bit pair must be unique in Alarm Logging. The same uniqueness requirement applies to status and acknowledgment bits. If multiple messages share the same bit, typically only the message with the lowest number shows up in runtime. This often happens after copying and pasting message definitions without adjusting variables and bits.
Analog alarms are another subtle case. WinCC documentation notes that analog limit-value alarms created with the analog procedure are a separate mechanism and cannot later be assigned to message tags. The creation dialog prevents message-number collisions with bit messages, but it does not retroactively manage tag assignments. If someone tries to rewire analog alarms to message tags after the fact, the configuration may not behave as expected and certain alarms will not display.
When I suspect bit assignment problems, I export the relevant messages from Alarm Logging and open them in a spreadsheet. Siemens provides an Excel macro specifically for checking duplicates. Even without the macro, a quick sort by message bit or status bit usually reveals collisions that explain why a particular alarm never appears.
Documentation also describes a scenario where chronological messages, sometimes called OS-compiled messages, do not appear even though other alarms work. In that case, the advice is straightforward: recompile and load both the controller program and the OS station. A partial or inconsistent compilation of OS objects can break the link between the AS and OS for those message types. On site, a clean compile-and-download sequence has often restored missing chronological messages with no further changes.
WinCC Unified Runtime and related platforms include a rich set of predefined system alarms. These alarms monitor the health of runtime services, storage, certificates, communication paths, and redundancy. In practice, these are the alarms that tell you why the HMI or WinCC system is not behaving, even if the PLC and process are fine.
System alarm IDs occupy a protected range and should never be reused by user alarms. Siemens documentation describes categories of system alarms along with recommended responses. Understanding these categories turns the HMI into a diagnostic tool for itself.
| System alarm theme | What it is telling you | Practical next check |
|---|---|---|
| Startup, shutdown, rollback, online backup | Runtime is starting, stopping, activating or rolling back a delta download, or attempting an online backup | Confirm that downloads, backup jobs, and version management steps really finished before investigating other symptoms |
| Memory and disk capacity | RAM or disk space, including external media, is low or critically low | Reduce load, delete unnecessary data, increase RAM or storage capacity, and ensure log archives are managed |
| Connectivity of managers and services | Internal managers such as Service Manager, Event Manager, Distribution Manager or drivers lost connection | Check network links, system service status, and configuration of the affected manager or driver |
| Redundancy and runtime version mismatch | Redundant partner is unreachable or runs a different runtime version | Verify network paths between redundant hosts and align both to the same configured runtime version |
| Configuration and filesystem consistency | Saving configuration changes failed, RDF files could not be merged, or delta activation failed due to damaged file system or locked project files | Check project folder write permissions, verify no external process is locking the files, and perform a full download if the project is inconsistent |
| Time integrity and time correction | Large time leaps were detected, or timestamps from external time sources were corrected as implausible | Check device battery and system clock configuration, and use proper time synchronization instead of manually changing system time |
| PLC and driver communication | Loss of connection to S7 PLCs, PLC in STOP while drivers remain connected, or driver overload conditions | Check PLC health and IP configuration, return PLCs to RUN where appropriate, and consider distributing load across additional drivers if overloads are frequent |
| Certificate and CRL health | Required certificates or revocation lists are missing, near expiration, or expired | Deploy the correct certificates and CRLs and renew them before expiration for secure runtime operation |
| Storage system write issues and removable media | External media is removed, disk space is low for external storage, or logging data has been lost in the storage system | Reinsert or configure removable media properly, ensure enough free space, and review logging configuration |
When I arrive on a site where alarms are ŌĆ£acting strange,ŌĆØ one of the first screens I open is a system alarm overview. If I see time integrity alarms alongside operator complaints that timestamps do not make sense, I prioritize time synchronization before touching PLC logic or HMI scripts. If there are repeated driver overload alarms, I know to look at tag rates, logging frequencies, and the distribution of PLC connections rather than immediately blaming network hardware.
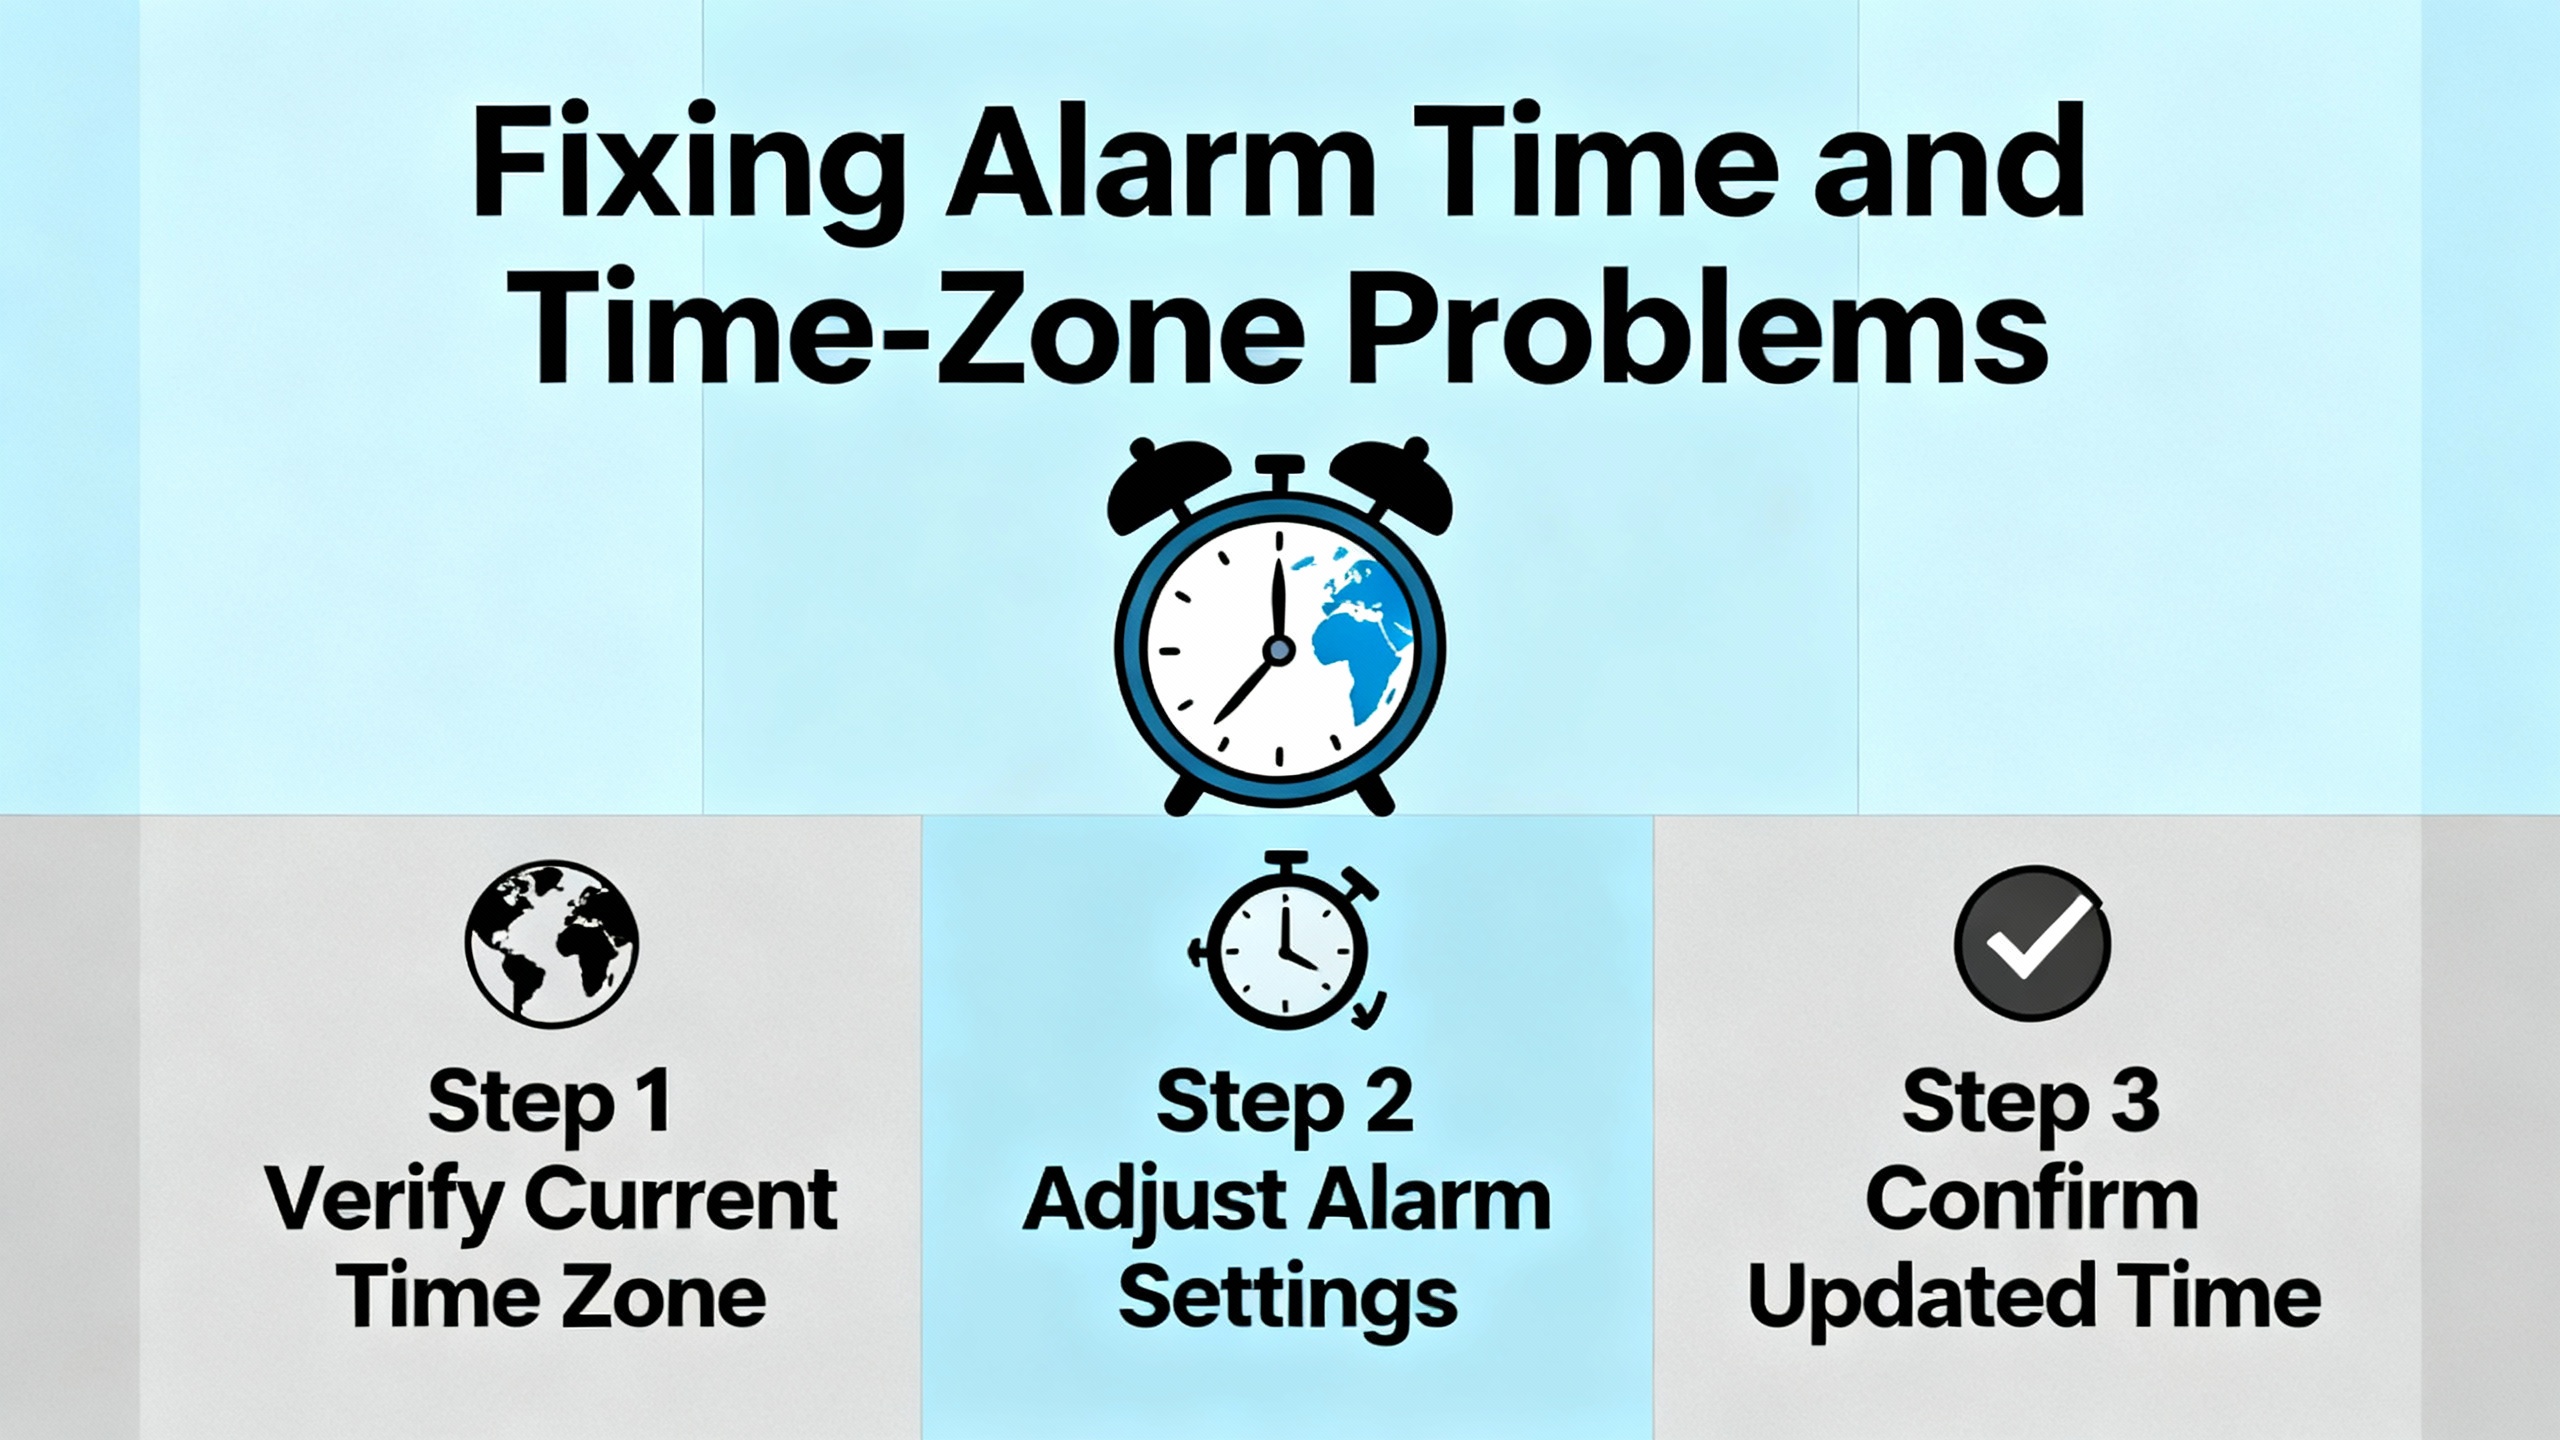
Incorrect timestamps make alarm analysis almost impossible. WinCC attaches a time and date stamp to each alarm when it is triggered and again when its state changes. Any dynamic fields in the alarm text are frozen with the values they had at that moment. The alarm display then takes those timestamps and, by default, converts them into the local time zone of the HMI device.
Siemens documentation explains that you can configure a different time base for alarm displays using a time base configuration function. This is useful when a central control room monitors equipment across multiple sites in different time zones. The display can convert timestamps to a target time zone while still keeping the underlying event time intact.
Time-integrity system alarms are raised when WinCC detects time leaps beyond a configured threshold or when external time sources propose timestamps that are too far into the future or unreasonably old. For example, a default configuration may treat an external time more than a few seconds ahead of the HMI system time as implausible. In those cases, the system logs a time correction alarm and indicates that it has adjusted values.
The key practical recommendations from Siemens are to avoid manually adjusting the system time and instead rely on proper time synchronization. If you see time leap alarms, check the device battery, NTP or similar synchronization settings, and overall system clock configuration. On site, I often correlate the timing of those alarms with operator feedback: if operators saw alarms jump backwards or forwards in time around the same moment, that reinforces the diagnosis.
Once alarms are generated correctly and displayed in runtime, the next layer is reporting and archiving. Engineers often build custom reports to summarize alarm activity over a shift or day, typically printing to paper or PDF or generating Excel files for analysis.
A support case discussed on a control engineering forum is a textbook example. An engineer used a SIMATIC CPU 1510SP-1 PN with a PC-based HMI running WinCC Runtime Advanced, engineered in TIA Portal V20. A custom report layout was created specifically to print alarms. The engineer added an Alarm View control to the report layout, selected the alarm buffer as the data source, drove the start and end date and time from HMI tags, and triggered printing with a button calling the Print Report function. At runtime, alarms were clearly visible in the on-screen display, a separate report for flow readings printed correctly, but the alarm report saved as PDF came out blank. Because communication with the live plant PLC was healthy and other reports worked, the suspicion was a misconfiguration of the alarm report, the Alarm View in the report, or its filter criteria.
This kind of situation is where you must methodically strip the configuration down. The runtime documentation makes it clear that alarm views depend on configured columns and filters and on the data source you point them to. In a case like this, I typically create a oneŌĆæpage test report that uses the same alarm buffer but no dynamic date filtering, hardŌĆæcoding a wide time window that certainly covers existing alarms. If that test report is still blank, the problem is more likely a data source binding or an Alarm View configuration issue than a time filter. If the test report shows alarms, the issue lies in tag values driving the start and end time or in additional filters applied on top of those tags.
Siemens also stresses that report performance and behavior depend heavily on the volume of data requested and on template design. The documentation for Unified Runtime reports recommends adding multiple data source items within a single segment instead of creating many separate segments, as this reduces processing overhead. It also recommends querying only the runtime data that is actually relevant by carefully configuring the Columns section of each data source item. Overly broad column selections or unnecessary joins increase data transfer and processing time.
The amount and resolution of logged data also matter. For tags logged with interpolate or stepped calculation modes, the configured interval directly affects how many data points the system generates. When many logging tags are configured with short intervals, the resulting datasets can slow report generation significantly. In that case, increasing intervals for noncritical tags or selectively logging fewer variables may be necessary.
Graphic content is another practical factor. The recommendation from Siemens is to limit both the file size and the number of graphics imported into report templates. Large or numerous graphics substantially degrade report generation performance and can contribute to timeouts that manifest as incomplete or failed reports.
Finally, report jobs are queued and processed with a controlled concurrency. Up to a configured number of jobs can run, and new jobs are queued. When already intensive jobs are running, starting many additional report jobs, especially heavy PDF jobs, may block the system and frustrate operators. Planning report jobs and scheduling intensive ones during lowŌĆæload times, such as overnight, is an important part of a robust alarm-reporting strategy.
When choosing output formats, Siemens documentation encourages the use of XLSX wherever possible because it is faster to generate than PDF. For large reports that must be archived as PDF, one recommended pattern is to generate XLSX first and then convert to PDF in Excel or LibreOffice, understanding that some Excel features may not be represented identically in the converted PDF.
Beyond individual alarms, you have to decide how to log the history of process values and alarms themselves. A Siemens application example on logging process values and alarms with WinCC in TIA Portal emphasizes starting with a logging concept rather than randomly enabling data logs. The goal is to choose a concept that meets requirements for runtime performance, access protection, and reliable data output and evaluation, then derive the necessary hardware from that concept.
This application example walks through different ways to access and evaluate logs. One program example shows how to access data logs stored on a Comfort PanelŌĆÖs memory card externally via a web interface, so engineers can view logged values without sitting at the panel. Another example describes importing text or CSV data log files into a prepared Excel template that automatically produces trend charts to visualize process history.
The same document also covers logging of string tags. You can log strings using scripts or by mapping them to discrete alarms when an event-style record is more appropriate. Mapping strings into alarms effectively promotes them into the alarm system, which is useful if they represent operator actions or textual process events that must appear in an alarm list. Alternatively, you can keep them as logged tag values and focus on later analysis and reporting.
There are options to read relational database logs through Excel sheets or through SQLite, enabling more advanced processing of historical values. Siemens training courses for WinCC TIA Portal devote time to these logging concepts, including data backup, long-term retention, and statistical evaluations such as minimum, maximum, mean, geometric mean, and histograms or distributions. For alarm troubleshooting, robust logging is essential because it lets you correlate alarm bursts with process values and operator actions.
For older WinCC versions up to V5.x, Siemens describes a dedicated diagnostic internal tag known as the Tag Logging health display. This internal tag ranges from 0 to 50,000 and indicates whether Tag Logging is keeping up with archive reads. In healthy operation, the value regularly returns to 0, meaning the system is fully reading values from the archive. If the value remains above 0 for roughly five to ten minutes or longer, Tag Logging cannot completely read values and parts of the runtime display show interpolated data instead of actual archived values. That is an early warning that logging performance is inadequate.
The recommended optimization sequence is threefold. First, monitor the health display value continuously on the affected process image for at least an hour to establish a baseline. Second, configure short-term process value archives to use the dBase III format in the Tag Logging project properties, then save and restart Tag Logging. Siemens reports that using dBase III improves archiving and read performance and can allow processing of roughly five hundred measured values per second. Third, if the problem persists, increase the SQLANY database cache so that WinCC can temporarily store more Tag Logging data and drain the database queue faster. This involves adjusting registry values for the SQLANY engine cache under appropriate keys for single-user or multi-user systems and then validating the effect by again observing the health display.
Although this diagnostic tag is specific to older WinCC versions, the mindset remains valid for modern systems: measure logging performance, change one parameter at a time, and then reŌĆæmeasure instead of guessing.
Not every alarm originates from your process logic. Siemens TIA Portal and WinCC Professional can integrate PLC system diagnostics so that hardware and network faults become rich, contextual alarms in your HMI.
System Diagnostics in TIA Portal provides detailed information such as rack and slot numbers, device type, and failure type that goes beyond simple process alarms. According to engineering guidance, S7ŌĆæ1500 CPUs have system diagnostics enabled by default and you cannot disable it; configuration mainly involves hardware and network setup and compiling the project. For S7ŌĆæ300 and S7ŌĆæ400 CPUs, you must explicitly enable system diagnostics in the CPU properties, where you can also create a status data block and name and number system diagnostics blocks. The optional status data block is automatically updated by system diagnostics and can be read by the PLC program or HMI.
The example network described in one tutorial shows a WinCC PC station connected via Profinet to S7ŌĆæ1500 and S7ŌĆæ300 controllers, with remote racks and variable-speed drives on separate Profibus networks. When you compile the CPU hardware, the system generates organizational blocks such as OB82 for diagnostic interrupts, OB83 for module insert and removal, OB85 for priority class errors, and OB86 for rack failures. Together with the diagnostics blocks, these OBs handle events like module failures, rack loss, and communication faults.
On the HMI side, a typical layout includes an alarms screen showing pending diagnostics alarms with timestamps and descriptive text, a diagnostics overview screen with a graphical representation of PLC racks and modules, and an event log screen that provides a longer-term alarm archive. WinCC controls include an Alarm window object for alarm and event lists and a Diagnostic View object for the hardware overview. Establishing HMI connections to each PLC is necessary so that diagnostics data can flow.
When testing such configurations, engineers often use PLCSIM to simulate module failures and rack or node faults. For example, they may simulate failure of a digital input card by changing a module address to an external voltage failed state or simulate station failure of a drive on Profibus. The resulting alarms help verify that diagnostics are correctly wired through to the HMI. Operators can then drill down into the CPU diagnostic buffer on screen, navigate to the lowest-level component, and see precise error text, part numbers, and suggested remedies such as missing auxiliary voltage on a given card. Standardizing these diagnostics screens across projects greatly reduces fault-finding time when real hardware problems occur.
A recurring theme in both Siemens documentation and practitioner discussions is that not every event should be an alarm. A WinCC alarm system that treats every minor status change as an alarm quickly becomes unusable.
One WinCC Professional engineer described needing to display three types of events: alarms that may require acknowledgment and operator intervention, warnings that do not require acknowledgment or intervention, and general events such as switching a pump on or closing a valve. Their initial approach used a single Alarm View object with filters to present different event types on different screens, but they felt this was unsatisfactory, especially because general events are conceptually not alarms.
The WinCC alarm model, with its alarm classes and priority mechanisms, is designed for exactly this kind of distinction. Alarm classes define behavior and acknowledgment concepts, so grouping true alarms of similar severity and operational impact into dedicated classes keeps operator expectations consistent. Priority can be set at both the class and individual alarm level, with the perŌĆæalarm setting overriding the class priority. Analog limit alarms are naturally suited to indicate critical limit violations, while general process events might be better suited to logging rather than the alarm list.
In the logging concept described earlier, Siemens notes that string tags can be logged either via scripts or by mapping them to discrete alarms for event-style recording. Mapping every minor event to an alarm creates a noisy alarm system. In practice, I tend to reserve actual alarm classes for conditions that either require operator action or represent abnormal states, and I log general events such as pump starts or valve position changes as data logs for later analysis. This aligns with best practices described in an article on WinCC alarm management and notification systems, where effective configuration and disciplined use of alarms are emphasized to avoid overload and keep alerts actionable.
Historical logging of alarms is crucial not only for troubleshooting but also for compliance and root-cause analysis. A wellŌĆæimplemented alarm management system in WinCC, with clearly defined alarms, warnings, and general events, enables operators to monitor critical events in real time, analyze alarm occurrences later, and respond quickly. It also sets the foundation for notifications, where critical alarms are pushed to the right personnel via configured channels.
If communication is healthy and process pictures are updating, the most common reasons for missing alarms are filters and server selection in the Alarm Control, the 1,000ŌĆæmessage display limit, and configuration issues in Alarm Logging such as shared message bits. Clear all runtime filters through the selection dialog, confirm the control is configured to show the correct server or all servers, and review the Alarm Logging configuration for duplicate bit assignments. If only certain message types are missing, recompile and reload both the AS and OS as Siemens recommends for missing chronological messages.
WinCC stores alarm timestamps when alarm states change and then converts them to the HMIŌĆÖs configured time base. If time-integrity system alarms are present, that indicates detected time leaps or corrections for implausible external times. Do not rely on manual clock changes. Instead, check the device battery, ensure that system time synchronization is properly configured, and review any time base conversion settings in the alarm display. Addressing those underlying time issues usually stabilizes alarm timestamps.
When the internal Tag Logging health display stays above zero for extended periods in older WinCC versions, or when driver overload system alarms appear in newer systems, the logging and communication subsystems are operating beyond their comfortable threshold. Siemens documentation suggests optimizing archive formats, tuning logging intervals, reducing graphical and data complexity in reports, and in some cases increasing database cache or distributing load across additional drivers. Measuring the health indicators before and after each change is the most reliable way to confirm that performance has improved.
Solid alarm troubleshooting in WinCC is less about heroic lastŌĆæminute fixes and more about understanding how the alarm engine, logging, and diagnostics pieces fit together. When you know how alarm classes, IDs, triggers, system alarms, and logging interact, you can walk into a noisy control room, look at the HMI, and methodically work down from symptoms to root causes. That is what keeps lines running at 2:00 AM and what separates a merely configured system from one that operators actually trust.


Copyright Notice © 2026 mooreautomated.com All rights reserved,Moore Automated is not an authorized distributor or representative of the manufacturers featured on this website. Brand names and trademarks featured are the property of their respective owners.
Leave Your Comment