

3503E
Get A Quote
Unplanned downtime often starts with a small failure: a sensor quits, a drive trips, a bearing seizes. Maintenance can diagnose fast, yet production still waits on a single question: is the right replacement part on site? If not, a repair that takes an hour can shut a line down for days.
This content uses common plant cost drivers (lost output, overtime, scrap, freight). Use your own rates and safety rules, and follow OEM instructions for installation, testing, and lockout/tagout.
Once a line stops, the clock covers more than hands-on repair time. The longest block can be waiting for approvals, sourcing, shipping, and receiving. The points below show where delays stack up and how to shrink them.
"Lead time" is the total time from identifying a needed part to having it staged and ready to install. In dependability standards from the International Electrotechnical Commission, this fits under maintenance support and supportability work: planning the resources that keep equipment running at the lowest practical cost and risk.
Typical outage steps:
A missing spare stretches the "source" and "receive" steps. It also raises the odds of wrong-part orders, such as mismatched voltage, connector type, or firmware level.
After the root cause is known, leaders need a fast cost estimate that holds up in a review meeting. Clear math supports decisions like expedited freight, overtime labor, or stocking a spare for the next event.
Unplanned downtime hits availability, a core factor in OEE. OEE is commonly expressed as Availability × Performance × Quality, and availability loss includes events that stop planned production time.
A simple worksheet:
Assume a packaging line runs 240 cases per hour with a contribution margin of $6 per case. A servo drive fails. The mechanical work takes 45 minutes once the drive is available. The correct drive ships in 36 hours.
Total event cost can exceed $59,000, driven mainly by the wait, not the repair. Document the assumptions in the work order so later decisions (stocking, vendor choice) stay traceable.
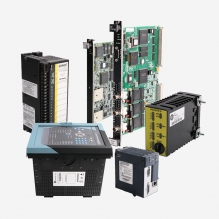
Not all items deserve shelf space. The goal is to cover components that stop the line and take time to source. The examples below highlight parts that often create the longest waits and the highest industrial downtime risk.
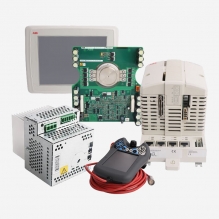
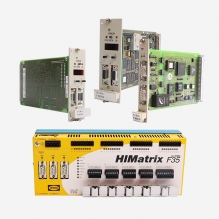
A single electronic item can disable a large section of a line:
The part itself is only half the job. Firmware, parameters, and safety configuration can block a restart even with new hardware. Keep verified backups and version notes tied to the spare.
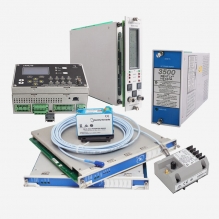
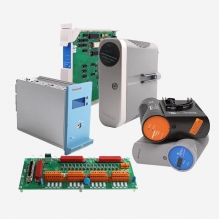
These parts often involve heavy logistics, rigging, and alignment:
Lead time can include shipping plus fit checks, calibration, and commissioning. That is why stocking and readiness work better than last-minute sourcing.
Stocking decisions work best when they follow a repeatable method. A simple ranking keeps debate low and focuses capital on the parts that prevent the worst outages and reduce maintenance risk.
A practical process:
The Society for Maintenance & Reliability Professionals publishes a best-practices and metrics reference that many maintenance and reliability teams use to define and calculate KPIs in a consistent way across sites.
A simple reorder point keeps parts from drifting to zero:
Reorder Point (ROP) = expected usage during lead time + safety stock
Example: a site uses 2 proximity sensors per month, and supplier lead time is 6 weeks (1.5 months). Expected usage during lead time is 3 sensors. If a stockout would stop production, add safety stock, such as 2 more sensors. ROP becomes 5 sensors.
Even with a strong list, stockouts still happen. Process controls can cut time spent on approvals, receiving, and wrong-part orders. These steps reduce downtime without bloating inventory.
A shelf spare is not useful if it lacks connectors, gaskets, brackets, or a parameter file. Build kits that include the common "missing pieces" and store them together.
Many high-cost items are repairable: drives, motors, gearboxes, pumps, actuators, and boards. A rotation pool (installed unit + tested spare + unit in repair) reduces cost and improves response time.
Shorten internal delays with:
Emergency buys can raise counterfeit risk, especially for electronics. Require traceable vendors, label photos ahead of shipment, and bench tests for the highest-risk parts when practical.
Spare parts plans drift as lines change and vendors discontinue models. A light governance rhythm keeps the list current and ties parts' spending to measurable downtime reduction.
The International Organization for Standardization published ISO 14224:2016, which provides a structured basis for collecting reliability and maintenance data in a standard format in petroleum, natural gas, and petrochemical settings. The same discipline can improve CMMS data quality in other industries.
A monthly or quarterly review can cover:
KPIs that stay actionable:
Start with parts that stop production and have long or uncertain lead times. Use downtime history, then confirm lead time with suppliers. Stock items with high impact and slow replacement.
Use a higher target for line-stoppers than for convenience items. The right target depends on downtime cost and lead time variation. Track fill rate and stockout-caused downtime to adjust.
Combine a short critical list with repair loops and supplier agreements. Add consignment for high-cost items. Standardize part families and keep approved alternates to reduce wrong-part delays.
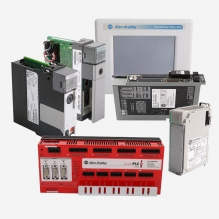
PLC modules, drives, safety controllers, and vendor-specific HMIs often create long delays, especially when firmware and configuration are not controlled. Keep tested spares plus verified backups and version notes.
The definitions and metric structure used here align with widely used maintenance and production references. Use the original documents for formal compliance needs and for site-specific program design.


Copyright Notice © 2026 mooreautomated.com All rights reserved,Moore Automated is not an authorized distributor or representative of the manufacturers featured on this website. Brand names and trademarks featured are the property of their respective owners.

Leave Your Comment